
This is a continuation of a remarkable thread that has now received 10,000 comments running to well over a million words. Unfortunately its size has become a problem and this is the reason for the move.
The history of the New Statesman thread goes back to December 2007 when Dr David Whitehouse wrote a very influential article for that publication posing the question Has Global Warming Stopped? Later, Mark Lynas, the magazine’s environment correspondent, wrote a furious reply, Has Global Warming Really Stopped?
By the time the New Statesman closed the blogs associated with these articles they had received just over 3000 comments, many from people who had become regular contributors to a wide-ranging discussion of the evidence for anthropogenic climate change, its implications for public policy and the economy. At that stage I provided a new home for the discussion at Harmless Sky.
Comments are now closed on the old thread. If you want to refer to comments there then it is easy to do so by left-clicking on the comment number, selecting ‘Copy Link Location’ and then setting up a link in the normal way.
Here’s to the next 10,000 comments.
Useful links:
Dr David Whitehouse’s article can be found here with 1289 comments.
Mark Lynas’ attempted refutation can be found here with 1715 comments.
The original Continuation of the New Statesman Whitehouse/Lynas blogs thread is here with 10,000 comments.
Max
The Lia is generaly reckoned to have had two final spikes in 1850-as Cru started recording- and in 1880-which coincides with Giss. Temperatures peaked just prior to both these start dates. 1810 was generally considered a very cold decade and it would hardly be surprising that temperatures should rise since.
Temperatures plunged around 1350 from the peak of the MWP and generally edged upwards since then, but with some very notable peaks and troughs. The periods round 1420, 1530 and 1730 appeared to be very little different to today. Moberg missed the 1730’s warm period.
tonyb
Max,
when you write
“It doesn’t much bother me whether or not anyone has left wing views. What is of more concern is that those left wing views are the motivation for climate change scare mongering, but the scare mongering itself is dressed up in a scientific guise.”
It describes the problem perfectly because that’s the way you see it. It would be fair comment if the Socialist Worker, maybe in collaboration with a few other left wing papers, had taken it upon itself to declare that AGW a problem in the face of all scientific advice to the contrary.
You think the BBC to be part of the ‘ultra left’ too but can you imagine them joining in too, taking such an anti-scientifc line as say Fox News or the WSL?
Its not a Left versus Right issue. Its the ultra-Right versus mainstream science.
Robin
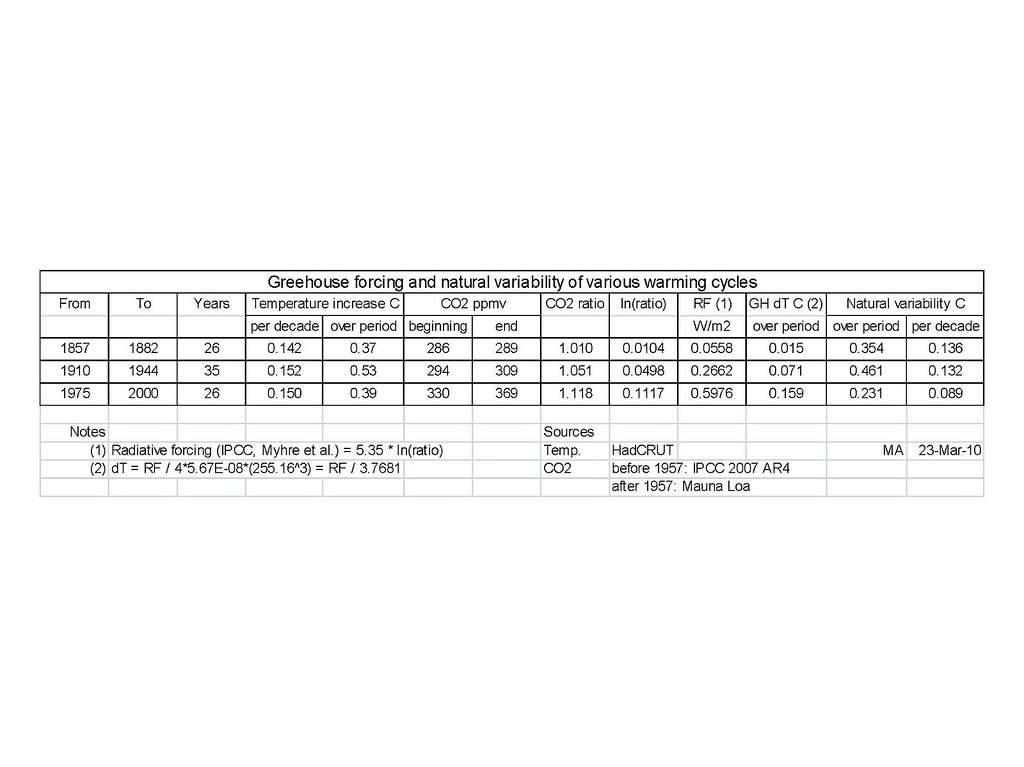
Your query on natural variability got me to thinking, so I ran a quick calculation.
The three warming cycles since the modern HadCRUT record started were
· Late 19th century (roughly 1857 to 1882, 26 years)
· Early 20th century (roughly 1910 to 1944, 35 years)
· Late 20th century (roughly 1975 to 2000, 26 years)
These were all statistically equivalent. Jones has agreed to this in the BBC interview, while he used a slightly shorter time frame for the late 19th century.
If we calculate the theoretical GH warming from CO2 over these three periods, we see that there was a significant portion of the warming that was not related to the greenhouse effect. This is based on the IPCC formula for calculating the GHE of CO2, the IPCC statement that other anthropogenic factors cancelled one another out, the HadCRUT temperature record and IPCC estimates plus Mauna Loa values for atmospheric CO2. It also assumes no “hidden in the pipeline” postulation.
The portion attributable to natural variability is around the 0.1C per decade mentioned in the study you cited:
0.14C per decade (late 19th century warming)
0.13C per decade (early 20th century warming)
0.09C per decade (late 20th century warming)
See table for calculation:
http://farm3.static.flickr.com/2781/4461030222_963892bedd_b.jpg
Will keep looking for the Jones report confirming the 0.1C figure.
Max
PeterM
As I pointed out with the paraphrase of your silly sentence: it would be just as SILLY if it were turned around.
This is NOT my view, as I clearly stated. It is simply a paraphrase of your SILLY sentence (which may or may not represent YOUR view.
Got it?
(It’s really not that complicated, Peter. You just have to read what is written and not make up stuff.)
Max
Empirical data, Peter.
Still waiting.
Max
Max,
Empirical Evidence? Here it is
http://www.ipcc.ch/publications_and_data/ar4/syr/en/contents.html
Max,
You say that the last quote wasn’t your view.
What about this?
“Forget all the junk science by so-called experts that are all in on the multi-billion dollar “climate research scam”?. Forget all the disaster reports being sold by environmental activists via the sensationalist media. Forget all the self-righteous calls for action by power-hungry politicians. Use your common sense. It’s all a hoax.”
Would you say that was a bit nearer the mark?
PeterM
Sorry. You apparently do not know what “empirical evidence” means.
It does NOT mean 1,000+ page pseudo-political IPCC reports with future projections, backed by some spotty and often bogus “science” (as is becoming more and more evident).
It means data derived from actual physical observations, rather than simply model simulations based on theoretical assumptions.
And what you need to support with these empirical data are NOT:
– that it has warmed over the past 150+ years, since the modern temperature record started
– that sea levels have risen over the past century or more, since tide gauge readings started
– that Arctic sea ice has receded since 1979, since satellite readings started
– that many non-polar glaciers have receded since around 1850
– that atmospheric CO2 levels have increased, since around 1958 when Mauna Loa readings started
– that human beings have emitted CO2 as a result of fossil fuel combustion, at an increasing rate since the end of WWII
These are all obvious, undisputed facts.
What is missing is:
Empirical data based on actual physical observations to support the premise that AGW, attributed principally to human CO2 emissions, represents a serious potential threat.
That’s what’s missing, Peter, and that is what both Robin and I have repeatedly asked you to provide.
Keep trying.
Max
PeterM
That quote is accurate. As you see, it has nothing to do with “left” or “right”.
It has to do with junk science (as we are now seeing very clearly with each new revelation).
It has to do with scare mongering by environmental activists (Gore, Hansen, etc.)
It has to do with a sensationalist media that capitalizes on doomsday fads.
It has to do with calls for action (i.e. carbon taxes) by power-hungry politicians.
All this is still very pertinent, although Copenhagen, Climategate and the current cooling since 2000 may have signaled a “sea change”.
Don’t you agree?
If not, with which part do you not agree?
Max
Robin
Coming back to the estimate you cited for warming attributable to natural variability.
The calculated weighted average rate of warming not attributable to the anthropogenic greenhouse effect over the three warming periods is 0.12C per decade, quite close to the 0.11C per decade warming attributable to natural variability according to the study you cited.
This is compared to around 0.03C per decade average theoretical anthropogenic greenhouse warming over the three periods, using the IPCC estimates for radiative forcing, with no assumed net feedbacks and no energy “hidden in the pipeline”.
From this one could conclude that the natural:anthropogenic ratio is about 4:1.
Max
Max,
So let me get this straight. You like the US tea parties. You don’t like Obama and the Democrats. You don’t like the UN. You don’t like government. You like the idea of minimal taxes. You don’t like environmnentalists. But you aren’t right wing?
You dismiss the IPCC report I linked to as just so much “hot air”. Yet you describe yourself as a “layman”. If so, how do you know it is incorrect from a scientific viewpoint? Isn’t it stretching credibility a little far to suggest that your ‘not-a-right-wing’ viewpoint is not your motivating force?
PeterM
You want to get my “likes and dislikes” straight, so let me see if I can help you.
As a rational skeptic, I like empirical data to support scientific hypotheses, such as the premise that AGW is a serious potential problem caused principally by human CO2 emissions.
When empirical data are lacking, as is the case for the AGW premise, I am rationally skeptical of the premise until such data can be presented.
I do not have much of an opinion on US tea parties, except that they appear to result from disappointment and frustration with the current US administration, principally the US Congress.
Obama seems like a very nice person, so I do not dislike him. He has a few screwy ideas (such as cap ‘n tax), which I do dislike, since they will accomplish nothing positive whatsoever and would put added pressure on the entire world to follow. In all fairness, I have to agree that “cap ‘n tax” is not Obama’s screwy idea per se, but he seems to support this silly concept (possibly as a result of input he has gotten from his certifiably screwy senior science advisor).
What is there to like or dislike about the UN? Switzerland thought long and hard about joining and some think it was probably a mistake to do so. The organization has had a problem with corruption, but this is understandable when you consider the many corrupt governments that have sent delegates there. UN peace keeping forces have had mixed reviews, but there may be no better alternate in some cases.
As a Swiss, I do like democratic representative government that tunes in to the wishes of the people who have elected it. Like with any good thing, too much is too much, so it should be enjoyed in moderation. Local (communal) government is preferable to cantonal (or state) government, which in turn is preferable to federal (or central) government; this is quite simply because the more local a government is, the better it can respond to the wishes and needs of its electorate. There are, however, many functions, which are best handled at a federal or centralized level, and I like a central government, which handles these effectively and efficiently..
I realize the need for taxes (at all levels) but I do not like excessive taxes (who does?). I like the Swiss system where the largest slice goes to the local communities, the second-largest chunk goes to the cantons and the smallest piece goes to the federal government.
I like real environmentalists (as opposed to AGW-freaks). I am against pollution and waste. I like energy conservation and alternate domestic energy sources (such as hydroelectric and nuclear in Switzerland, which has no fossil fuels).
I am not “right wing” or “left wing”.
I do not “dismiss the IPCC report as hot air”. I just see that it is full of errors, exaggerations and omissions, which all go in the direction of making AGW sound more ominous than it really is. Many of these errors are now coming to light. I also see that the IPCC report, despite its extremely large volume, presents no empirical data to support its premise that AGW, caused principally by human CO2 emissions, is a serious potential threat. Instead it relies on flawed model simulations to make this claim.
One does not have to be a “climatologist” (whazzat?) to see the weak spots and bias in the IPCC report. They are glaring.
In your last sentence you asked:
Not at all, Peter. Expand your mind out of the old out-dated “left-right dispute”. As a rational skeptic, my primary objection to the AGW premise is that it is not supported by empirical scientific data (like creationism, intelligent design and a host of other “beliefs”). You have not been able to provide such evidence, despite your strong belief in the premise.
Unlike the other “beliefs” I mentioned, however, AGW also has extremely large political, social, financial and policy elements, and is, in fact, a multi-billion dollar big business today, with many individuals and organizations already cashing in and others lining up at the trough to benefit from proposed trillion dollar taxes in the future.
This aspect makes it all the more important that the premise is not based on shoddy, biased or flawed “science”, but on sound empirical scientific evidence.
So I hope I have straightened you out once and for all about my motivations here, so that you no longer persist in bringing up silly conjectures based on your overly active imagination.
Max
Max,
I think if you do check your notes you’ll find that you did, on the 3 April 2007, refer to the IPCC report as “It’s all hot air”. I’m just wondering how much time you spent studying the report before coming to that conclusion?
The IPCC has referred to 1000’s of papers. Some are based on climate modelling. Many more are based on an empirical measurements.
I’m really don’t know what sort of paper you are looking for and I’m sure that you don’t either. Except that you seem happy to be asking for something that know which cannot possibly exist.
But maybe I’m wrong in saying that. Maybe you’d like to tell us the sort of experimental results which you’d be happy to accept, one way or the the other, to decide the issue.
If you can’t do that you are just playing with words to try to discredit mainstream science and support your-not-right-wing political stance.
PeterM
Sorry.
I do know what I am asking you to provide, in order to support your premise that AGW, caused principally by human CO2 emissions, presents a serious potential threat.
It is, quite simply, empirical data, based on actual physical observations, which support this premise, as both Robin and I have told you many times.
Quite simple, actually, except that you have been unable to provide such evidence.
Does it exist? Who knows? No one has been able to show it to me as yet, and I will remain rationally skeptical of your AGW premise until someone does, as I am also rationally skeptical of “intelligent design” and “creationist” hypotheses, for exactly the same reason.
Max
Max
PeterM
Just some semantics regarding the rather long-winded AR4 report and its precursor, the 2007 SPM report, which came out in early 2007, based on 2006 or earlier data.
Ignoring for now the many things that are correctly reported plus the numerous errors, exaggerations and omissions, many of which are just now coming to light, the report does contain an awful lot of what I would refer to as “hot air”.
This is, of course, just my assessment.
Max
Max,
Well maybe you could describe just what data you’d like to see recorded or what experiments you’d like to see done! I don’t think you have the first clue as to what you are asking for but you could also try prove me wrong and show you are scientifically rather than politically motivated; and that your quest is a genuine one rather than just an attempt to set such a high level of “proof” that no-one can ever come near to it.
PS. A little tip: If you are trying to avoid being associated with the sort of right wing elements who make the most noise on the AGW issue you should avoid these kind of remarks:
Keep those “tea parties” humming. If enough people become aware of what the “renewable energy bill” really means (“cap ’n trade = carbon TAX), they will certainly reject this concept and let their Senators know to do the same. Right now it’s taking back stage to the health care plan. Are the two linked? You betcha!
After promising all Americans earning less than $250,000/year a tax cut, the Administration needs lots of bucks to finance another campaign promise: health care.
What better source could there be than the well-camouflaged “cap ‘n trade” bucks? After all, it’s only the big, bad oil and coal companies that have to pay this.
Liberty is what it’s all about.
PeterM
You continue to waffle and squirm when you ask:
The answer (in caps, since you appear to be having a bit of difficulty grasping it).
ANY EMPIRICAL DATA BASED ON PHYSICAL OBSERVATIONS, WHICH SUPPORT YOUR PREMISE THAT AGW, CAUSED PRINCIPALLY BY HUMAN CO2 EMISSIONS, IS A SERIOUS POTENTIAL THREAT.
For more clarification, refer also to my post 33.
The ball is in your court, Peter.
Max
Max:
You say (post 35) “The calculated weighted average rate of warming not attributable to the anthropogenic greenhouse effect over the three warming periods is 0.12C per decade”. Maybe. But that’s very different from Brill’s simple assertion (after noting Phil Jones’s confirmation of a 1975-2009 temperature increase of 0.161C per decade) that
That, if I understand the data correctly, is misleading. Yet it’s at the heart of Brill’s paper – otherwise reasonably well presented and argued.
TonyN:
Why has your system’s clock just changed by an hour? It’s not BST yet.
Max/PeterM:
Here’s an article that may help re empirical evidence (a concept Peter seems not to understand). As you see, it refers to a web-based debate (hosted by an AGW supporter) about statistical support for the AGW hypothesis. A taster:
Here’s a quotation from one contributor to the debate:
Note that: it’s about “real world data”. I’d be interested in your comments.
Robin
The 0.11C per decade warming due to natural variability since the end of the LIA sounds exaggerated to me, since it would mean that we have seen 2.3C warming attributable to natural variability since around 1800, while the few studies I have seen on this indicate around 1C total warming over this period.
The average total warming since 1850 was around 0.65C, or an average rate of 0.041C per decade.
For the three multi-decadal warming periods we have seen since the modern record started in 1850, a warming of 0.12C per decade attributable to natural variability would sound reasonable; this would theoretically leave around 0.03C per decade on average for anthropogenic greenhouse warming.
I have not been able to access the 2005 Jones et al. study, which cites this 0.11C per decade warming from natural variability.
Sorry I can’t help you.
Max
Robin
The Thomas Fuller article citing the blog site of Dutch scientist, Bart Verheggen, is very interesting.
Without going into the intricacies, it appears that the correlation between CO2 and temperature is not robust enough statistically to provide statistical support for causation.
In arriving at this conclusion, Verheggen specifically excludes the theoretical considerations (GH theory, Stefan-Boltzmann, etc.) and concentrates solely on the statistical correlation based on “real life” observed data.
Even this analysis would fall short of providing empirical data to support the dangerous AGW premise were it to show a robust statistical correlation, since even robust correlation does not provide robust evidence for causation. But the lack of such a robust correlation would seem to provide fairly compelling evidence against the premise, as the contributors have apparently concluded (assuming the observed data are correct).
Interesting stuff.
Let’s hope it all gets compiled and formally published.
Max
Max:
My reaction on reading Brill’s paper was that his 0.11C assertion must be wrong. It seems I was right. If so, that kicks one of his arguments firmly into touch. It’s interested that, although invited (twice) to comment, Peter didn’t even notice this apparent flaw in a sceptic’s position. Perhaps he was too busy investigating his political background.
Max:
I agree about the Verheggen blog: very interesting.
Your point about correlation/causation is important. Indeed it’s fundamental: when politicians, the MSM etc. are challenged about their claimed “overwhelming evidence” for AGW, they commonly trot out examples of the (usually ghastly) consequences of increased temperatures implying that, because it’s happening, mankind must therefore be responsible. Peter does the same thing: viz. his recent reference to a research paper about the depredations of a North American beetle.
Robin #44:
Probably because the WordPress server is in a time zone that has summer time before us. It should correct on Saturday night.