
A post by Steve Milloy of Junkscience has turned up some interesting figures about the ‘Population Bomb’. Here they are:
Per capita global food production has […] increased by 26.5 percent between 1968 and 2005, according to the World Resources Institute. The number of people who starve to death daily declined from 41,000 in 1977 to 24,000 today, according to The Hunger Project, an organization combating global hunger
http://junkscience.com/ByTheJunkman/2008082108.html
If you multiply 24,000 by the number of days in a year, this works out at about 8.7 million deaths from starvation per annum; a million more than the whole population of Greater London.
Later in his article, Milloy mentions that:
According to U.N. statistics, the number of people in the developing world who were considered to be undernourished in 1968 was estimated at about 900 million. That estimate is on track to be reduced by more than 50 per cent by 2015, according to the U.N.
The United Nations is an organisation that loves to take credit for any improvement in the human condition, and it has no shame about self-administered pats on the back. But looking more closely at these figures, we find some rather nasty facts that we should all be ashamed about.
If the number of undernourished people in the developing world has almost halved in the last forty years, that still leaves nearly 450 million people today – almost half a billion out of a global population of about 6 billion – who do not get enough to eat. And of course malnutrition increases mortality rates from numerous causes other than starvation.
The downward trend is encouraging, but it should not be used to disguise the fact that in the first decade of the 21st century, more than one in 13 of the world’s population are deprived of the most fundamental necessity of existence; they are not getting enough to eat.
If these figures applied equally to both the first world and the developing world, then what would the reaction of European and North American governments – and the electorates that have voted them into office – be? Just imagine what our priorities would be if 13 out of every 100 people in the UK were undernourished? What would the headlines in the media say?
At the moment there is much hand-ringing among world leaders about the ‘world food crisis’,which has been caused, in part at least, by demand for biofuels. And until quite recently, biofuels were hailed as one of the alternative sources of energy that could stop climate change. The organisation that has done more than any other to spread alarm about possible global warming is, of course, the Intergovernmental Panel on Climate Change, a UN agency.
I only saw the starvation and malnutrition figures because I happened to get an email notification about Steve Milloy’s article. So far as I know the press and the rest of the mass media made nothing of the story. Contrast this lack of reaction with the following, which comes from a lead story in the Washington Post in 2005:
Climate Shift Tied To 150,000 Fatalities
Most Victims Are Poor, Study Says
By Juliet Eilperin
Earth’s warming climate is estimated to contribute to more than 150,000 deaths and 5 million illnesses each year, according to the World Health Organization, [another UN agency] a toll that could double by 2030.
The data, being published today in the journal Nature, indicate that climate change is driving up rates of malaria, malnutrition and diarrhea throughout the world.
http://www.washingtonpost.com/wp-dyn/content/article/2005/11/16/AR2005111602197.html
Not surprisingly, this story was the subject of worldwide headlines within hours, and the mantra ‘climate change is killing 150,000 people a year’ has remained popular with global warming advocates ever since.
Whether or not the small rise in global temperatures that we saw during the 20th century was caused by human activity, and can therefor be controlled, has yet to be decided. What is certain is that it is well within our capabilities to make sure that people get enough to eat, provided that the political will exists to give this matter priority.
I have no opinion on the validity of the WHO’s research, which was carried out by the University of Wisconsin; it is the public attitude that interests me. The figure for supposed climate change induced deaths is one-three-thousandth of that for malnutrition. There is a body of research that shows that mortality anomalies are higher when temperatures fall than when they rise, and it is common ground that natural variation in temperature has always been a characteristic of Earth’s climate. One thing that we can be sure of is that global temperatures are not, and never have been, constant. There will always be a trend either up or down, and there will always be some people who suffer as a result.
Many climate change sceptics consider that the present concerns about global warming now amount to hysteria, and our assessment of the scientific evidence is no longer rational. If this is the case, then millions in the developing world are going hungry unnecessarily while the eyes of the first world are focused on efforts to control the climate.
This kind of hysteria kills.
Peter Martin, Reur 42 and 43: thankyou, seriously, for the effort you have put in, but I’m sorry to say that you have entirely missed the main point that was revealed in the graphics that I posted in my 41. (that was what you were referring to; my 41?)
It’s a bit scientific, (even statistical), but you need to understand primarily the significance of the regional variation cycles on the continent of Oz being far in excess of the global warming average trend, by an order of magnitude. (but yet the mean of those “violent” cycles does not amount to much). Beforehand, and if I can find time to sit down and labour through an explanation for you, of that great significance, could you please revisit the above and seriously crease thy brow? Please: try your best…. Hoping in anticipation.
Meanwhile, I will shortly start watching the new series science journalism TV show on ABC; “Catalyst”, and hope it has a bit more science and less journalism this time around!
Bob/Peter:
Which gets nearest to the truth – this or this?
Or maybe this?
Hi Peter,
Enjoyed your Grist blog to the rather confused and overly emotional blogger there. BTW I returned your favor.
In your #50 to Bob_FJ you wrore,
“And it is our climate. It isn’t owned by some US based multinational. No-one should be surprised that they may feel that it is though.”
I would wholly endorse this statement.
I would also add this slight paraphrase to make the comment a bit more inclusive:
“And it is our climate. It isn’t owned by some UN based intergovernmental panel of taxpayer funded bureaucrats. No-one should be surprised that they may feel that it is though.”
Could you agree with adding this second thought to round out your statement a bit?
Regards,
Max
Peter
Referring to me:
I don’t even bother to find out what they say, and the fact that the BBC is publicly owned has nothing to do with luck.
Do you think that this is a convincing response from the BBC?
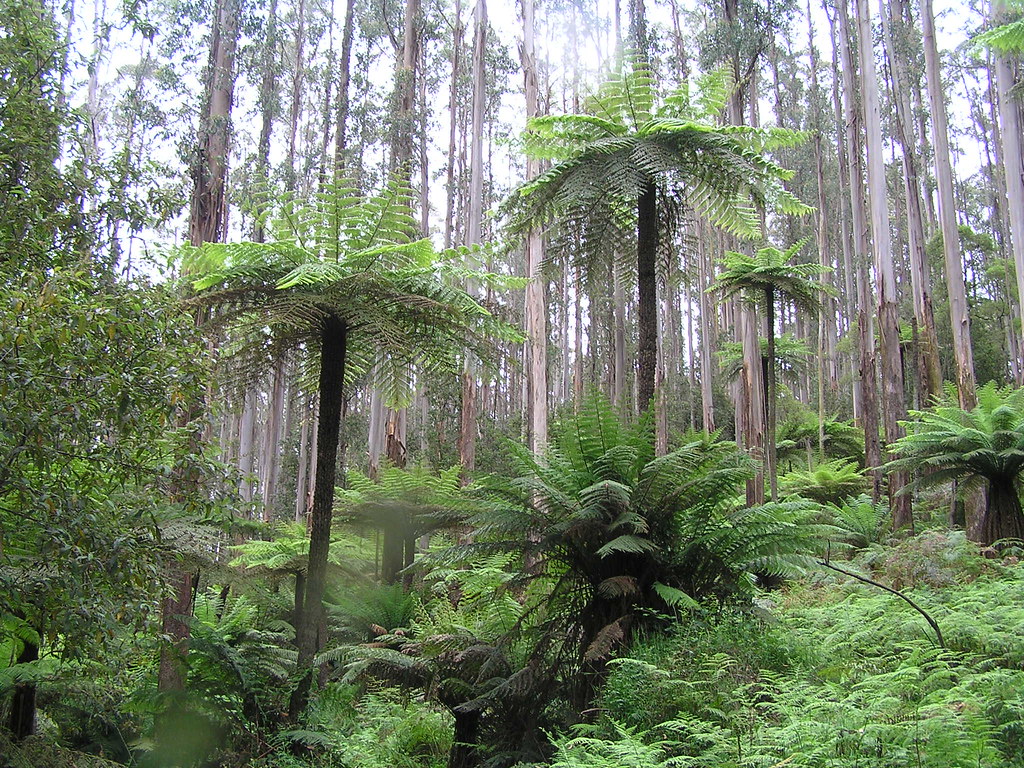
TonyN; here are three shots of new growth Eucalyptus Regnans (Mountain Ash) since you asked.
This is beside the road over the famous Black Spur which is less than an hour from my place, and approaching Marysville, my beloved town-no-more. That forest was killed by the massive wildfire in 1939, and these guys are from seeds that can only naturally propagate after fire and best so on a bed of ash. They are currently packed much too close together from that dense seedbed, and will need to thin-out by falling over from storm damage whatever, (as they evidently do), before they can girth-up and become giants at between 300 and 500 years or so.
The next shot shows some understorey ferns including at least two species of tree fern. The new growth of straight young fronds on that in the left near foreground suggests that it was springtime, but I don’t remember when I snapped this.
The next shot shows (left and distant right) also some acacia XXXXXXX, (Blackwood), I can’t think the full botanical name at the moment, which is a tall tree that flowers magnificently in the ski season. Acacias exist in about 600 species throughout Oz, and are more commonly known as wattles. I think the flowers might be known as mimosa in England. Blackwood has very beautiful furniture timber with a huge range of grain colours from almost black through earthy reds to almost white. I have some growing in my bush back garden.
Peter Martin,
Re my 41 above, you seem to have gone quiet on your two assumptions:
a) That the recent heatwave in the SE of Oz was caused by global warming
b) That the continuing Victorian bushfires are caused by global warming
You also enthusiastically piled-in at Gristmill, expanding your ideas , but have gone quiet there too.
Does this mean that you agree that you were wrong on both a) and b)?
Re graphic
Mount Juliet ablaze; I meant Sat 14th (Today), not Sat 7th
Bob_FJ,
“Does this mean that you agree that you were wrong on both a) and b)? No
Max,
I probably should say that Pres Reagan wasn’t as dopey as he was often portrayed. He certainly made up with whatever he was deficient in with a sly cunning!
Pushing the climatic issue in the hands of the UN and the IPCC was quite a masterstroke by either him or one of his advisers. That way it was almost guaranteed to provoke the antagonism of the American right wing who’ve always thought of the UN as little better a communist front.
Understandably, the Bush administration made no effort to take it back. Neither would you guys want them to either. You enjoy being able to write about “UN based intergovernmental panel of taxpayer funded bureaucrats”!
The UN may not be perfect but I’d have to say that the world is better off with rather than without the organisation. I suspect that the part of the UN that I intensely dislike, mainly the security council which guarantees a veto to Russia, China, USA, France and the UK is probably one of the parts that successive USA administrations have liked the most.
It’s not the UN or the IPCC who are claiming ownership of the atmosphere. But, yes, that’s what large multinationals do claim. They consider it their “God given” right to pollute it as much as they like.
Peter Martin, Reur 59 where you advise me: No
So I deduce that you still don’t understand that a fundamentalist assumption can be wrong after all of the tutorials here and at Gristmill.
OK, here is some different data from Oz BOM, showing no correlation between climate change and severity of wildfires. This only shows temperature data for Victoria.
Are you able to comprehend this?
Do you wish to say that it is wrong in some way?
Bob_FJ,
Do I wish to say it is wrong in some way? For a start, the bush fires occurred in February not January.
This report was published in the Melbourne Age in the morning of the 7th Feb. You’ll notice that there were no mention of any fatalities at this time.
http://www.theage.com.au/national/city-swelters-records-tumble-in-heat-20090207-80ai.html
Later that day, new and existing fires raged out of control. The report mentions previous record temperatures on Black Friday and Ash Wednesday. Both days are well known in Australia for deaths caused by bushfires. So it does seem that there is a general pattern of record temperatures leading to bushfires. Every degree adding to the intensity of the fires when they do break out.
Very high temperatures historically have always occurred from time to time in the Melbourne region and the state of Victoria. Bushfires too. Add the effects of AGW to the natural variability and you’ll get very high and record breaking temperatures, and the bushfires than accompany them, more frequently than otherwise.
Maybe you could give me the references for your graphs?
P e t e r M a r t i n, In your 61, responding to my 60, you have sidestepped the issue I raised, which was; quote: “OK, here is some different data from Oz BOM, showing no correlation between climate change and severity of wildfires. This only shows temperature data for Victoria.” I’ll rephrase that in case you still have difficulty understanding it:
According to the OZ Bureau of Meteorology, (BOM), using their time series graphics for average maximum temperatures in Victoria ONLY, there is clearly no correlation between global warming and the severity of grass and bushfire tragedies, (or average maximum temperatures for that matter).
One point at a time: here are some additional graphics for you, which very clearly show that there is no correlation between global warming, and the temperatures that set-up the conditions conducive to wildfire, which is typically triggered by lightning strike on dry fuel in the dry season December – March
Note that diurnal and other average data may well show different trends to what is seen in the following, but they are irrelevant to THIS issue, which is emphasized in bold above:
Are you able to understand this issue (stated in bold above) now?
ALL:
This is in the bushfire news. I emphasize three words in bold:
Eight bushfires are still burning out of control around Victoria this morning, but no towns are under direct threat.
While favourable weather is expected until Wednesday, no heavy rain is forecast and strong wind could change things quickly, Country Fire Authority (CFA) spokesman Gary Weir said. 16/02/2009 7:42:00 AM. | AAP
Bob_FJ
I’m emphasising five words “…… snapped during last Saturday’s strong winds and heat.”
Incidentally. It looks like, of the several fires which caused deaths on Feb 7th, it will turn out they will have been caused by different factors. Arson, lightning strikes, electricity cables sparking, sparks from machinery etc. If the bush can burn, it will burn should be the lesson that needs to be learnt.
Look, graphs are fine but I’m not sure what you are trying to show. Its not that hard to see from the BOMs own data that central Australia has warmed much faster than the global average. Its now about two degrees hotter, on average, than it was sixty years ago. When the winds come from the sea towards Melbourne the temperatures will be cool. Not much different at all from 50 years ago. But when they come from Central Australia they’ll be much hotter, dryer and stronger.
Ideal conditions for bushfires which will occur more frequently.
Let’s see what the Royal Commission say about this in their report.
Peter Martin, In my 60, after you denying other evidence both here and at Gristmill, I tried another tack and wrote in part, (bold emphasis added):
“OK, here is some different data from Oz BOM, showing no correlation between climate change and severity of wildfires. This only shows temperature data for Victoria.”
It was a graph showing for VICTORIA alone, the annual average MAXIMUM temperatures from 1910, and another graph for VICTORIA alone, giving the monthly average MAXIMUM temperatures from 1950 for the month of January through to 2009. That month was as close as I could get to 7 Feb 09, because Feb 2009 is not yet available, and neither are similar monthly data available prior to 1950. (apparently)
These graphs clearly showed that there has been no correlation between any assessment of global warming either globally or in central Oz, and the Victorian MAXIMUM T’s. Note at this point also, that average annual T’s or minimum average T’s or diurnal variation, or data for other regions in Oz or the world are not the same as average MAXIMA for VICTORIA alone.
In your 61 response you did a typical crap-filled sidestep, but since you said the following, in part:
I wondered uh?; but thoughtfully posted in 62; BOM graphs for VICTORIAN monthly MAXIMUM temperatures for December through March from 1950. (incidentally, I now notice there is a typo on the year dates; a year behind…..Feb & March 2009, not yet available) These graphs, are generously astride the normal dry or fire season and very clearly show that there is no correlation for the last 58 years between global warming, and MAXIMUM monthly temperatures in VICTORIA, during the fire season.
I also rephrased my original question, (bold italics above), in case some extra words might help you understand.
According to the OZ Bureau of Meteorology, (BOM), using their time series graphics for average maximum temperatures in Victoria ONLY, there is clearly no correlation between global warming and the severity of grass and bushfire tragedies, (or average maximum temperatures for that matter). I then reiterated several times what the issue was, with reference to it being stated in bold font in the text above…. Pretty hard to miss really.
However, in you 65, you came out with your usual irrelevant or misleading/distracting waffle, apart maybe from this gem:
So, I’ll extract some bits from what you say:
“…central Australia has warmed much faster than the global average. Its now about two degrees hotter, on average, than it was sixty years ago… …But when they come from Central Australia [north winds] they’ll be much hotter, dryer and stronger.”
Thus with your argument, you would expect recent monthly average MAXIMUM T’s in Victoria during the dry season to be approaching 2 degrees warmer than 1950, but the published BOM time series data clearly leans towards the opposite trend.
BTW, I want to take one thing at a time, and I’ll ignore some other errors you make for the moment
HINT: You should put aside any preconceived fundamentalist assumptions, and actually take note of the evidence. We had a somewhat similar exchange on the NS thread, on correct smoothing methods for time series data, where you continued to post WRONG graphs for months, and repeatedly disputed that you were wrong, and saying sillies like I should go and talk to Bill Gates. However, the penny seems to have eventually dropped, because you seem to have recently got it right somehow, without ever admitting that you were WRONG before.
Peter Martin, Sorry, I forgot to frame my 66 into a formal question. (as you have sometimes insisted)
Please take it as:
According to the OZ Bureau of Meteorology, (BOM), using their time series graphics for average maximum temperatures in Victoria ONLY, there is clearly no correlation between global warming and the severity of grass and bushfire tragedies, (or average maximum temperatures for that matter).
Do you agree that this is correct? (question)
Re : #67 No
Re: #66 It makes little difference. It is just a matter of convention. The graphs you seem to like are from last year; before I discovered that I could save myself a bit of work by using the built-in Excel trend lines.
If I’d been employed by Microsoft to write the routines I guess that they’d have been done exactly as you’d like them with a slight offset on the x axis.
But I wasn’t.
Peter Martin Reur 68, quoting your full response to my 67
It seems that you are experiencing the same spatial perception problem that you exhibited when you were using the WRONG smoothing technique (PMA) for time series data. OK, what I’ll do is present something a little bigger with guiding construction lines and hope you can understand what the actual data actually means this time:
I show January 2009, that being the closest available to February 2009. The same logic can be applied to the earlier graphics of broader scope.
Bob_FJ,
The Royal Commission on the Victorian fires will be starting shortly, if it hasn’t already.
They’ll be calling witnesses from the Australian BOM. What do you expect they will be saying? That climate change has played no part? I don’t think so. But let’s wait and see.
There is no need to doctor the BOMs graphs. There are lots to choose from on their website which clearly show that the number of hot days, and the hotness of those days, is increasing.
Such as:
http://www.bom.gov.au/cgi-bin/silo/reg/cli_chg/extreme_trendmaps.cgi
Peter Martin Reur 70, you wrote in part
Why you bring this distraction up is not clear, but according to ABC radio news earlier, the Royal Commission is expected to start in about two weeks, and the main topics so far listed are centred on how to prevent human tragedy in the path of strong-wind-blown wildfire, such as addressing the optional policy of “stay and defend”, communications, and building codes etc. I have not heard any mention of climate change so far, but no doubt it will be raised, just as some ill informed people blamed buckled railway lines in Melbourne on climate change, when the real culprit was neglected replacement of old timber railway sleepers.
I can’t see how the BOM could be emphatic on suggesting the Victorian fires were caused by climate change, given that their MAXIMUM temperature data shows no correlation with global warming in this region for decades.
You also wrote:
Perhaps you should clarify what you mean by your statement: “doctoring the BOM graphs”. I hope you are not suggesting that I have altered any of the BOM data. That would be a new low in the level of simplistic assumptions that you make. I have reconfigured for compactness and notations etc, yes, but changing data; no.
The fact is that the graphical time series data from BOM that I have collated, (feel free to check), is precisely their data and shows no correlation between VICTORIAN maximum temperatures and global warming.
The different graphic that you present showing trend of number of very hot days since 1950 shows a significant up-trend in North West NSW supporting what you have said elsewhere about the hot centre, but as far as the area around Melbourne is concerned, the trend is zero on “your” graph from BOM. (also nearby in NSW and SA) As I’ve already said, that may seem counter intuitive to you, but I suggest that you should study and accept the published BOM graphical data, and not assume something different.
Bob_FJ,
If you’ve worked out to your satisfaction that climate change played no part, two weeks should be enough time to polish up your submission to the Royal Commision.
But they won’t be asking me, or you, even though there’s no reason why you shouldn’t send them what you know anyway, but they may well be asking Prof. David Karoly, Professor of Meteorology at the University of Melbourne in Australia who writes on RealClimate:
http://www.realclimate.org/
“So, did climate change cause these fires? The simple answer is ‘No!’ “
Surprising? You’ll have to bring yourself to click on the above RealClimate link to find out if he really does agree with you.
Peter Martin, Reur 72,
I will ignore your irrelevant waffle therein, but remain interested in you responding to several issues that you have evaded in my 71 and beforehand.
1) Please clarify what you mean by your apparent accusation of me: “doctoring the BOM graphs”.
2) Please confirm that you agree that the BOM graphics that I have presented in 69, 62 & 60 show no correlation in the state of VICTORIA between monthly average MAXIMUM temperatures and global warming.
3) Please confirm that you agree that the BOM graphic link that YOU have presented in 70 shows no correlation in the state of VICTORIA between the number of very hot days and global warming.
4) Please confirm that you agree that the BOM graphics that I have presented in 60 show no correlation in the state of VICTORIA between yearly average MAXIMUM temperatures and severe bush fires, (or global warming), as far back as 1910, (The biggest was in 1851; Black Thursday)
I guess you will continue to evade these issues, so here are some alternative entertainments:
5) Please advise if you really meant to write in your 65, “But when they come from Central Australia [the north winds] they’ll be much hotter, dryer and stronger.”, and if you still believe this to be true.
6) If your answer to 5) is that you believe a “hotter desert centre” will result in stronger north winds, would you please advise why it was that when the airflow from there was very gentle during the January 3-day heatwave in Melbourne, the temperatures slowly built-up as follows: day one; ~43C, day two; ~44C & day three; ~45C?
Bob_FJ,
Its not me you have to convince. I pretty much agree with Prof Karoly. Except that he’s perhaps understated the temperature rises that have been experienced by regions in Central Australia. Its all in the links from the Aussie BOM that I’ve posted.
I’d suggest that you lay off the Cabernet-Merlot for a while, or whatever is your tipple these days, keep your head clear, and write up whatever proof you claim you have as clearly and intelligibly as you can. Then send it off to the Royal Commission.
Lets wait and see what they report.
Some thing strange happened this afternoon. Did a couple of comments, from Bob and Peter, disappear?