
Peter Taylor’s CHILL: a Reassessment of Global Warming Theory is really two books in one. The first part covers the science of climate change in exhaustive detail and provides an alternative to the orthodox view. Taylor, who has impeccable green credentials, describes “the technocratic and communalist approach” in a masterly analysis of how we arrived at this point through “a combination of zealotry which somehow has managed to portray the science as unequivocal when it’s not”. The second part covers policy, politics and remedies.
A main theme of the first part of the book is that we take too linear a view of
climate-trend projections, without recognising past patterns and cycles
which could include future cooling. I am comfortable with that notion, as any observer of history is provided with clear evidence that climate oscillates in numerous
cycles of warm and cold periods.
Readers who believe Al Gore’s Inconvenient Truth, and who consider the IPCC
climate assessments are factual, unbiased and objective, will not like this
book. As Taylor says: “It is clear to me that IPCC has made such a forthright commitment to the standard (Co2 ) policy model, that it has a biased attitude to new data that does not conform to that model.” And:
“It is striking that a small group of men working behind computer screens created a virtual reality in which the future climate became the enemy of mankind. That original cabal was likely innocent of any underhand motivation and genuinely believed mankind faced a threat and that they would sound the alert and potentially stave off disaster. But sociologists will go a little bit further and look at the social environment that pawned the very concepts of the climate game, many of which we take entirely for granted. For example the notion that humanity itself can be under threat or that the planet might need to be saved. These are very recent notions, at least from a societal perspective, and do not bear closer scientific scrutiny. “
This book is a breath of fresh air in pointing out the numerous contradictions in the orthodox climate science camps that believe themselves uniquely exempt to the notion that they should actually prove their scientific hypotheses – that by altering the climate and doubling Co2 emissions, mankind will cause a rise in temperatures of up to 6 degrees C.
The author clinically examines areas of uncertainty, plain misunderstandings, and assertions in the existing ‘consensus’ by reviewing numerous high quality ‘contrarian’ papers that rarely receive much coverage in the science and popular media, which is obsessed with the notion of anthropogenic global warming. Climate science is a very small world with authors frequently peer reviewing each other’s papers, some of which might be based on their own work in the first place (Google US Congress hearing by Wegman). Also, they often pronounce on subjects of which they have little
knowledge. When talking of Solanki – a leading solar scientist – Taylor comments:
“This is another classic example of senior scientists publishing in the peer
reviewed literature and commenting on issues entirely outside of their field,
such as carbon dioxide and atmospheric physics, without reference to other
entire fields of relevant climatology, seriously compromised by
compartmented approach or political correctness in the face of
‘controversial’ science.”
That Taylor – and many other commentators – believes that even the IPCC’s
lowest Co2/temperature rise scenario exaggerates its case by at least a
factor of three is amply illustrated, and as the author demonstrates, sea
levels and temperatures have obviously not read the IPCC’s script.
Having demolished what currently passes for peer reviewed and settled
science, Taylor moves on to remedies and the consequences of the politics in
the second part of his book. He argues that we are not doing enough to adapt to
inevitable changes, and that in particular we are vulnerable to the climate
cooling, for which there is no ‘Plan B’ whatsoever. The author believes many
of the actions for mitigating the supposed impacts of warming are counter
productive. He stresses the need to create ‘resilient systems’ to cope with
all eventualities. As the author says in examining the ‘collusion of
interests’ he has identified; “I can see how it works to everyone’s interest
to believe in the scary climate story.”
This excellent but lengthy book deals with a difficult subject and therefore
its structure is especially important to ensure accessibility and achieve
the influence it deserves, but in this there are problems. For example,
omitting the chapter number at the head of each page yet referring to
chapter numbers in the text was irritating, as wer the constant references to
papers placed on the author’s web site. As much of the science is complex
and multi-layered, it cannot be read like a novel at one go, so it would be
useful to provide a chapter summary. Also I felt it was missing a chapter on
the IPCC’s politics, rationale and peer review processes, that would
illustrate how they became part of the ‘collusion of interests’ intent on scaring
everyone to death when really we have far more important things to worry
about. Nevertheless, the book remains essential and provocative reading.
Finally, to extract from the major review of the science in the first part
of the book is not easy, given the volume of material covered. But here is a
dip into the section on ocean cycles (page 131), which illustrates the tone
of the message:
“The oceans play a crucial role in the absorption and dissipation of heat
over decadal and millennial timescales and with distinct cyclic patterns.
These patterns are poorly understood and not replicated in global warming
models, and any conclusions drawn with respect to those models being able to
isolate an anthropogenic global warming signal must be regarded as unproven
and unlikely”.
These are brave words from a career environmentalist who has managed to keep his head when all around him are losing theirs.
CHILL: a Reassessment of Global Warming Theory
Peter Taylor
Clairview Books, 2009, 404 pages
£14.99 Pbk ISBN 978 1 905570 19 5
[or try www.abebooks.co.uk – TonyN]
For a profile of Peter Taylor follow the link;
Here is the Hadley Data referenced in the Fielding graph.
Peter Martin and JH
I don’t know if Christopher Booker reads this blog, but this article exactly mirrors comments made here recently, including the credentials of the current Chairman of the Met Office.
http://www.telegraph.co.uk/comment/columnists/christopherbooker/6257987/What-makes-Met-Office-long-term-forecasts-so-wrong.html
Sunday Telegraph 04 Oct 2009
What makes Met Office long-term forecasts so wrong?
Global warming dogma and faulty computer models led the Met Office to forecast
a ‘barbecue summer’ for 2009, says Christopher Booker.
By Christopher Booker
Most people are aware that the UK Met Office has in recent years become something of a laughing stock. Its much-derided forecast that Britain would enjoy a “barbecue summer” this year was only the latest of a string of predictions that proved wildly off-target. Three years ago it announced that 2007 would be “the warmest year ever”, just before global temperatures plunged by 0.7 degrees Celsius, more than the world’s entire net warming in the 20th century. Last winter, it forecast, would be “milder and drier than average”, just before we enjoyed one of our coldest and snowiest winters for years. And in 2009 it promised us one of the “five warmest years ever”, complete with that “barbecue summer”, when temperatures have been struggling to reach their average of the past three decades.
What should be rather better known, not least since it helps to explain these relentlessly optimistic forecasts, has been the leading part played by our Met Office in promoting the worldwide obsession with global warming, notably through its Hadley Centre for research into climate change. In 1988 the then-head of the Met Office, Dr (now Sir) John Houghton, was one of the two men chiefly responsible for setting up the UN’s Intergovernmental Panel on Climate Change, founded on their belief that rising CO2 would inevitably lead to higher temperatures.
In 1990, thanks to lavish funding from Mrs Thatcher, Houghton set up the Hadley Centre, which has continued to play a central role in shaping the IPCC’s increasingly alarmist reports ever since. Not least, it chooses many of the scientists who write those reports, most of whom are sure to be “on message”. In conjunction with the Climate Research Unit run by Professor Phil Jones at the University of East Anglia, equally firmly on side, the Hadley Centre also controls the most influential of the world’s four official sources of global temperature data.
Nothing more tellingly reflects the Met Office’s partisanship, however, than the fact that its present chairman is Robert Napier, a green activist who previously ran WWF UK, one of the most vociferous of the climate change lobby groups. Mr Napier now helps run not only the Met Office (which has been part of the Ministry of Defence ever since its forecasts came “from the Air Ministry roof”) but also an array of other bodies centrally involved in driving the political climate-change agenda.
He is, for instance, chairman of the Green Fiscal Commission, charged with “greening the UK tax system” by shifting 20 per cent of government revenues to green taxes by 2020. He is a director of the Climate Change Group, an international lobby group involving “a coalition of governments and the world’s most influential businesses”, “helping to set the targets, create the policies, build the confidence and generate the political willpower needed to make the changes the world requires”. He is chairman of the Homes and Communities Agency, which seeks to buy up land for “eco-towns” and dictates the need of new housing to comply with strict “green standards”.
Mr Napier is a director of the Carbon Disclosure Project, which claims to hold the largest database in the world on corporate carbon footprints, so that companies that fail to support the green agenda can be vilified for their part in destroying the planet. He is also a director of the Alliance of Religions and Conservation, a pressure group dedicated to using the world’s religions to push the same agenda. (I am indebted to a paper on the buythetruth.wordpress.com website – “Eco-Imperialism: Every Environmentalist’s Dream” – for pointing the way to all this.)
It might seem extraordinary that such a political activist should now be in charge of the government body responsible for providing our daily weather forecasts. But what makes it even more remarkable is that one reason why those short-term forecasts are often so comically wrong is that, as the Met Office likes to boast, they are produced with the aid of the same super-computer used to provide the IPCC with its predictions of what the world’s climate will be like in 100 years’ time.
The Met Office’s computer is programmed to believe that the chief driver of climate change is the rising level of CO2 – hence its predilection for forecasting barbecue summers and warmest-ever years. But in recent years, as we all know, while CO2 levels continue to rise, the trend of global temperatures has failed to follow suit. This might suggest that the basic assumption on which the computer models are programmed cannot be entirely correct. Is it not perhaps time we pensioned off all those “activists”, scrapped their expensive computers and went back to putting some proper “Met men” in charge of forecasting our weather?
http://www.telegraph.co.uk/comment/columnists/christopherbooker/6257987/What-makes-Met-Office-long-term-forecasts-so-wrong.html
TelegraphNews
Perhaps he asnd your Senator Fielding need to get together Peter and JH?
Just as an aside, we live 15 miles awaty from the Met office and this is the third day in a row they have got our weather entirely wrong. Now I know the difference betwen weather and climate and that trends are easier than specfics, but the Met office has got a poor record with both.
tonyb
Peter Martin
Your graph is not quite accurate as a comparison with Fielding’s graph..
Fielding’s graph started with 1995.
Yours starts with 1975.
Fielding’s graph shows monthly values only.
Yours also shows annual plus 5-year annual.
If you want to compare graphs, Peter, make sure you are comparing apples with apples.
If you do so, you will see that Fielding’s graph is 100% correct.
And that was the point of the exercise, right?
Max
Peter your #226
I tend to graph much longer periods and use actual temperatures as they are easier to comprehend to those viewing the data.
However as far as I can see Fielding appears to be correct (but I enjoyed your ‘added’ ingredients). I am sure when he revises it in due course he wil be able to accurately represent our 91st warmest summer that we ‘enjoyed’ this year (see BBQ summer article above)
I am not sure what point you are making. Fielding appears to be accurate. Do you believe differently? If so please give us your interpretation.
This current period enjoys very remarkable similarity to 1720-1740.
tonyb
tonyb
the need of new housing to comply with strict “green standards”
We often hear about ‘carbon neutral’ housing, but I have never really understood how this was possible. Once you’ve laid concrete foundations or opened a bag of cement, the idea must be doomed, surely?
Peter Martin
Back to Fielding.
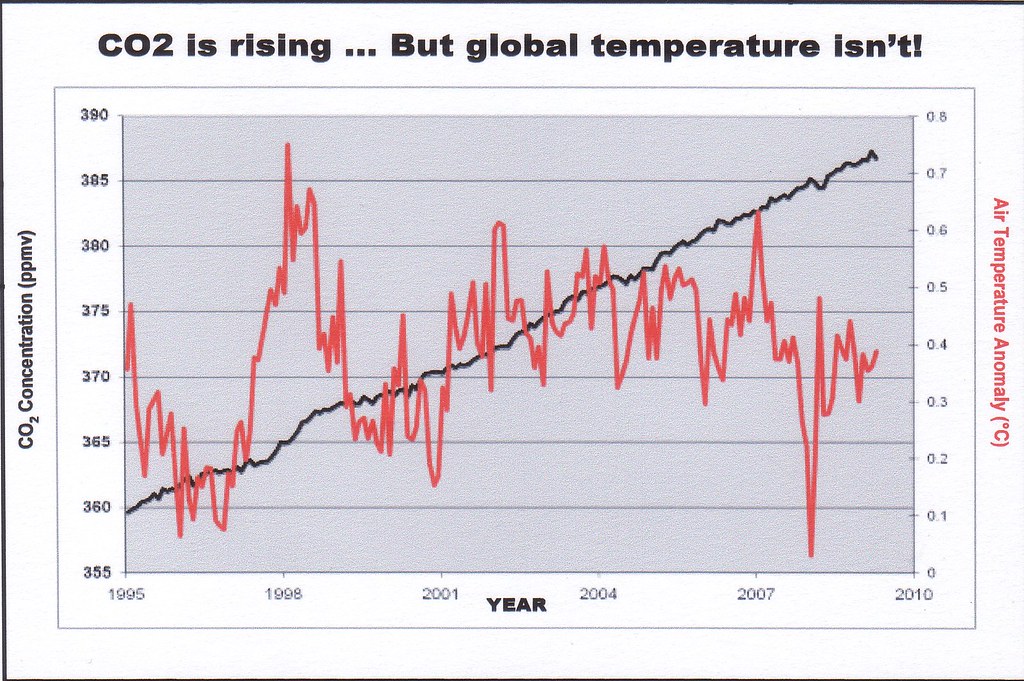
If you look at the briefing paper, you will see that Fielding showed a graph of the entire Hadley record starting in 1850, as well as a second graph starting in 1995 entitled “CO2 is rising … But global temperature isn’t rising!”:
http://sciencespeak.com/FieldingQuestions.pdf
The source is clearly referenced.
You were suspicious that Fielding may have fudged the data.
A closer examination shows that he did not. The graphs are accurate.
Just to make this easier to see, I have posted the 1995-2009 graph by Fielding as well as a plot of the cited Hadley data.
Fielding Graph
http://farm3.static.flickr.com/2641/3986246903_0d90bc7801_b.jpg
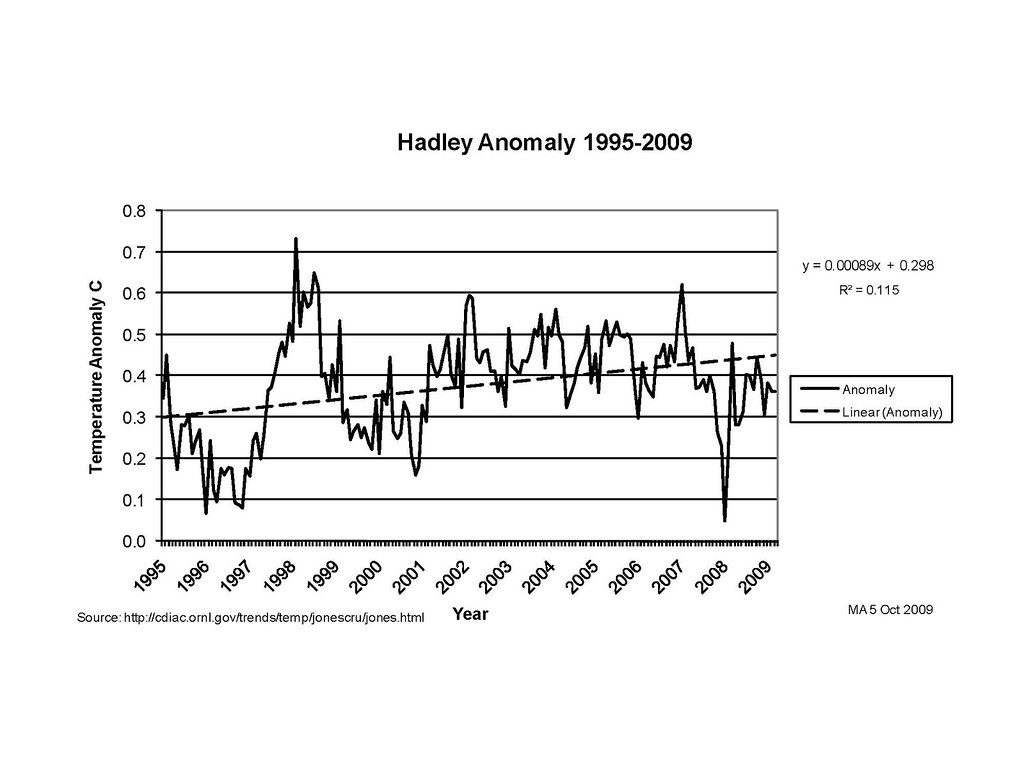
Hadley Record 1995-2009 (Fielding)
http://farm3.static.flickr.com/2574/3986249169_9f59cce7dd_b.jpg
The temperature records are identical, as you can see.
Max
Peter Martin / TonyB
Re 226 / 229
To Peter’s 1975-2009 temperature curve Tony wrote:
This is a very good point, Tony.
Senator Fielding did show a graph of the entire Hadley temperature record, and then later an extraction of the years since 1995, to compare the most recent trend of atmospheric CO2 concentration with that of the global surface temperature anomaly. His point here was that it has essentially stopped warming while CO2 has continued to increase (a valid point, as I am sure even Peter will agree, based on the observed facts).
I fully agree with TonyB, however, that short term trends are meaningless. This includes the 1995-2009 trend cited by Fielding just as well as the 1975-2009 trend plotted by Peter (and used by IPCC to prove the AGW premise).
What counts is the 1850-2009 trend, and it shows a gradual underlying warming trend with roughly 60-year warming/cooling cycles along the way. These are real data (even with all the known errors and inaccuracies in the base data, as TonyB has often pointed out).
Max
PS A totally separate issue was raised by Peter regarding the accuracy of the graph shown by Fielding for 1995-2009. This question has been layed to rest: Fielding’s graph accurately depicts the HadCRUT data, which he also cited in his briefing paper.
Max
I think the only thing Fielding is guilty of is not going back far enough in time.
As I have demonstrated many times here by posting graphs, there have been huge variations in temperature throughout the temperature record back to 1660 and the co2 line is entirely unrelated to them.
The co2 hyopothesis doesn’t work if temperatures have fluctuated considerably without the aid of added co2. This is why so much time is spent trying to minimise the LIA and MWP so they can be explained by ‘natural variabilty’ whilst ‘modern’ peaks can only be explained by added co2.
1850 was chosen as the start date for ‘global’ temperatures, as CRU felt that the limited number of station data available (around 35 at the time )that went much further back, was an unrepresentative number.
However, that is entirely inconsistent as that has not stopped the IPCC from basing sea levels (which represent 70% of the worlds surface) on three highly unrepresentative tide gauges with an enormous interopolation of data to stretch it back artifically to the chosen start date of 1700.
It is unfortunate that after 10 years of asking, the good Dr Jones appears to have lost the original data which would support the material he produces and clarify which stations were used in his construction, and why.
The other unfortunate thing is that I suspect masny of these older stations have withered and died. You can see numerous examples of this with the German stations I mentioned a few days ago, whose data finished in 1993 or so.
If old data sets had not been arbritarily discounted by CRU these would presumably still be recording information as they provide important parts of the climate jigsaw.
tonyb
Max,
I know you like linear regressions – when they suit your argument that is!
Although the 0.001 factor in the equation would appear to be so small as to be not worth worrying about, it should be remembered that this is a monthly figure. Multiply by 120 to get the decadal rise.
I can’t get Excel to produce the gradient to any more decimal figures but the graph itself shows a temperature increase of 0.2 degrees in 15 years. That’s approx 0.15 degC per decade which is close to the longer term average.
Peter Martin
You are fudging the data again. Shame on you!
Fielding’s graph started with 1995 (not 1994).
It shows monthly Hadley data.
I plotted these, as well, and the linear trend is as shown on my graph = 0.00089C per month, which equals a decadal warming rate of 0.107C per decade, but with an R^2 factor of only 0.115 (which makes the trend essentially meaningless).
Do not fudge the numbers to make the warming look more impressive, Peter. Just stay with the facts.
Fielding’s graph is accurate and his brief is well-presented and compelling. Read it through slowly, and you may learn something new.
I agree with TonyB, however, that he should have used the entire record to make his point that there is nothing unusual about the late 20th century warming. It is simply “deja vu all over again” (every 60 years or so).
Max
TonyB
To your 233, yes, of course I agree that a short term snapshot of our ever-changing climate proves nothing about the real trends and even less about the underlying causes for these trends.
What is clear is that the short-term “blip” used by IPCC (and the Met Office) to prove the AGW premise is far too short to prove anything at all.
The current cooling “blip” also proves nothing, although it has caused the Met Office to put out the “natural variability” smoke screen in order to defend its (short-term) AGW postulation.
A robustly supported MWP is a thorn in the side of the Met Office, IPCC and other supporters of the AGW premise, as you wrote, since it negates the claim of unusual 20th century warming upon which the entire AGW premise is based.
The even more robustly supported LIA also presents a dilemma for those who believe that climate is driven by atmospheric CO2 and that natural forcing factors have been negligible.
The short-term 60-year cycles we have observed at least since 1850 present yet another dilemma for the supporters of the AGW premise.
These (plus the repeated model-based Met Office forecasts that never come true) all add credence to Christopher Booker’s opening statement:
BTW, so has the IPCC, even if many politicians and other individuals are still clinging to the AGW premise to promote their own personal agendas.
And there are those who still fall for the hokum put out by the Met Office in its press releases, as well as the 1,000-page reports put out every 7 years or so by IPCC.
But their number is dwindling, as the polls have shown.
Max
Max
I thought you would be interested in another historic temperature data set, this one to 1720 and ironically from Arrhenius’s native city of Uppsalla.
http://www.smhi.se/content/1/c6/02/50/31/attatchments/upps_www.pdf
A remarkable degree of normality considering this was in the middle of the little ice age. It would trend up sharply again around the early 1600’s and the 1540’s-thought to be the warmest year in the last 500- before trending down again in the 14th and 15th century, then trending up again to the MWP.
Incidentally the Swedish met office has admitted to UHI problems with their current Uppsalla data as the city has grown around 50 fold since the time of Arrhenius.
tonyb
JamesP #230
You are right, but its much worse than this as new building regulations insist on certain methods of providing heating insulation cooling and associated air flow.
In anything other than small buildings this may mean that windows can’t be opened and air flow will have to be handled by machinery. This has the effect of greatly increasing costs and increasing emissions from machinery. There were lots of other associated nonsense associated with the new regulations that I posted on earlier this year.
In general I have nothing at all against greatly improving our poor insulation and building standards but this is not the way to do it
tonyb
JH
You started out your post # 194 with the comment:
After a few links you single out Australian Meteorologist and Climatologist William Kininmouth, and then switch to a debate with the Government Minister for Climate Change.
A panel of four scientists (Evans, Franks, Carter, Kininmouth) reviewed the reply of Minister of Climate Change Wong to the questions asked by Fielding. The panel concluded:
The specific questions were:
In a 5-page response, the Minister addressed the questions (but did not answer them). See:
http://joannenova.com.au/globalwarming/wong-fielding/4-wong-steffen-response-to-questions.pdf
Go through this in detail, JH. You will find that there are no straight answers to the relatively simple questions here. The Ministry response waffled around quite a bit, discussing a lot of peripheral issues but evading the direct questions posed and issues raised by Fielding. [This was also the conclusion reached by the panel, as stated above.]
Out of the 9 pages of the panel’s comments to the response by the Minister, you (cherry?) picked one single point (4.2) with your comment:
Can you be more specific about the “decent amount of flawed reasoning”, which you “picked out”? A blanket statement like this does indeed tend to confirm your statement that you are “an amateur”.
To what “other studies conducted on the matter” do you specifically refer? Can you provide references so that they can be compared with the study cited?
JH, if you want to critique something, you must be much more specific (and not just nit-pick about one study, which you deem to be inconclusive).
Come with some specifics, JH, and then we may have a point for further discussion.
Otherwise your comments are fairly hollow.
Max
JH:
You’re right about Climate and Weather being different and perhaps I should have been more clear about how the idea that we can’t predict the weather reinforced my skepticism and lead me to look for more information. I’ve bounced back and forth between blogs, papers (most of which I fervently hope have summaries) and debates. What I’ve found is true in many cases is that how a person discusses is as telling as the information provided and that no matter what information you’re given, the truth lies somewhere between both sides.
You are correct that the study of weather and the study of climate are indeed quite different as I’ve learned.
I’ve been told on many occasions that the study of climate is the study of trends. Is not a trend something we watch when the causation of an event is not entirely understood?
We watch trends in economics but most economists don’t really know what drives those trends. They use educated guesswork to try and divine where the trend will lead but the causation is poorly understood and prone to changes that cannot be explained. The same goes for market trends, social trends, historic trends, political trends, et al. Trends are a way to try and predict the future by watching the past and can be prone to wild speculation at the best of times plus are more likely to be inaccurate the further you extend out the trend. To not misrepresent myself, I don’t disregard trends out of hand. They (like other things) are invaluable tools. But there is always the danger of an inexplicable change of direction and that danger increases the further one tries to extrapolate.
In my attempt to flesh out my understanding of climate change I’ve heard ‘scientists’ say,’it must be co2 because we can’t think of anything else it could be’. The complete disregard of former members of the IPCC (being some of the foremost experts in the field of Climateology).
Please allow me to digress for a moment. One of my highschool science teachers was telling the class of a brilliant scientist, I believe it was Richard Feynman, and referenced his role (as discribed in his book) investigating the Challenger Shuttle disaster. In his book he wrote that a great majority their scientists were confident that the shuttle was ready to launch. While the rest of the investigators seemed to accept this, Feynman asked a follow up question. Feynman asked for the names of their top scientists, NASA’s top 5 minds. When given, Feynman asked how many of these 5 scientists gave a green light to launch. Only one of the five believed the shuttle was ready.
That story has come back to me often in the discussion, or lack thereof, of the science behind AGW. The dismissal of scientists, not on the basis of their science but on whom they have worked for.
Tempterrain @ 207
“And if it does apply equally, then surely there can never be a scientific consensus on anything at all according to your reasoning.”
I think the point is, TT, that a scientific consensus is a convienience for those not involved in the pursuit of science. A scientific consensus is not a scientific concept and should never, never be held as a carrot on a stick for those looking for information. When it comes to science the consensus is as easily proven wrong by new data as is the lone dissenter. A consensus causes complacency and an adherence to ‘established’ dogma. Science should always question itself, seeking new proof to either reinforce the accepted or shatter it so that new understanding can take it’s place. Science may agree with a consensus but should never trust a consensus to be incontrovertable truth.
Science leads to ever more probing and complex questions. Science does not lead to belief. Science leaves that to religion.
A personal (read anecdotal) note on heat pumps. I see that Wiki mentions that “Some air-source heat pumps do not work as well when temperatures fall below around ?5°C(23°F)”. It seems, however, that they have diminishing return up to that point. I live in the norther midwest of the USA. Wisconsin, specifically. And I’ve been in homes with heat pumps during the winter.
My impression … they don’t work worth a ****. Perhaps they’re enough for a more temperate climate but I’ve never been in a home heated by a heat pump that was even close to comfortably warm in the winter. I think that also might be why I never even heard the words heat and pump in the same sentence in North Dakota when I was stationed up there.
I’ll stick with natural gas for now, thermodynamic crime or not. (Or in the case of my current apartment, boiler/radiator).
My father asked me about a heat pump once. Said that they work on the principal that there’s always heat in the air. I told him that’s true all the way down to Absolute Zero. Even ice has heat energy in it but I wouldn’t want to wrap up in it to get warm.
Max
The specific questions were..
Those are good questions. I’d like to see George Monbiot answer them, especially as he was so keen to make his own, more convoluted, questions a condition of debate with Professor Plimer.
I can anticipate the reply though – it would be beneath his dignity to respond.
tonyb
nonsense associated with the new regulations that I posted on earlier this year
Here? I’d be interested to read.
Max,
So 1995 was a key year whereas the data for 1994 was totally unreliable? And I’m being criticised for using too much data rather than too little?
Ok have it your own way. Here is the graph starting in 1995 up to the present time. Happy now?
It makes hardly any difference. It shows a warming trend not a cooling trend.
A low correlation coefficient? Yes of course its monthly data. It would be even worse if it was daily data.
That should give you an idea. No matter how much warming we see in future years, to try to discredit the data you can reduce the sampling period to make the graph look more and more noisy!
Peter Martin
Don’t get defensive. No criticism intended for your starting with 1994 when comparing to Fielding’s graph that started with 1995. It could have simply been a screwup, but it just doesn’t make sense.
Fielding’s graph was totally accurate, contrary to your suspicion. Can you admit to this?
Had Fielding started his graph in 1998, it would have shown no trend.
Had he started it in 2001, it would have shown a cooling trend.
The point Fielding made (very effectively) is that global warming has stopped.
And, despite some waffling around the point, your climate minister was unable to answer why this is so (see my post to JH on this subject for more details).
You need to get a new climate minister, Peter – the one you have now cannot even answer basic questions concerning climate.
Max
Peter Martin
A simple question:
Do you now agree that the 1995-2009 temperature graph presented by Fielding in his brief was indeed accurate?
A “YES” or “NO” answer will do.
If you answer “NO”, please point out WHY his graph was not accurate.
That way we can end the discussion on this matter which you started with your #199 when you wrote:
Thanks in advance for your reply.
Max
Pete,
I’m not a weatherman, (or the ostentatious title “Climatologist”) so please excuse my ignorance; but doesn’t the theory indicate that temperatures should be getting warmer……causing snow events to occur increasingly LATER in the season?
SNOW PILING UP: Idaho school kids enjoy ‘earliest snow day in history’…
http://www.ktvb.com/news/nearyou/woodriver/ktvbn-oct0509-wood_river_power.1e96b181a.html
Colorado ski resort boasts ‘earliest opening day in 40 years’…
http://www.denverpost.com/extremes/ci_13498572
Vegas ski resort to open ‘earlier than it ever has’…
http://www.fox5vegas.com/news/21223890/detail.html
Perhaps, but they have been known to get it right.
http://news.bbc.co.uk/1/hi/6743877.stm
Theodore Dalrymple
Max,
My suspicion on the Fielding graph was that he, or someone who actually understands graphs, had got the data from an unreliable source. Such as Prof Ian Plimer who certainly does just make up data. Why ever would I think that?
The data itself does look OK but nevertheless it is carefully chosen to mislead. The graph has to start at 1995. Not 1994 and not 1996. 1995 was quite a warm year and it certainly ‘helps’ to have the graph starting on a high point. I notice too that he hasn’t included the last few months data. Is that because the graph was prepared a few months ago or is it because they are inconveniently high?
It isn’t so obvious by looking at the data that it shows a warming trend and it is misleading to suggest that it shows that global warming ‘has stopped’ I’m not saying that Sen Fielding is blatantly dishonest – in fact I’d be surprised if he were capable of applying a simple linear regression to the data. Nevertheless there are people behind him who are and I would just ask the question of why they omitted to include this in their graph?
Also I would ask why choose monthly data figures? Even yearly figures are questionable. Five year rolling averages are really the minimum time sampling interval which makes any sort of scientific sense.
But Senator Fielding is a politician not a scientist. He doesn’t understand the science. Some would argue that he doesn’t understand politics or the English language very well either.
BTW The Australian Liberals and Nationals have got themselves into a bit of mess politically over the proposed ETS. Their leader’s position is under threat and they would be annihilated in a general election of Prime Minister Rudd were unkind enough to call an election right now.