
While catching up on things this morning, a link at Bishop Hill took me to one of the most penetrating and concise commentaries on the Hockey Stick controversy that I have seen, and it comes from a rather surprising source.
I’m not going to attempt to summarise what it says, mainly because if I did so it would probably give the impression that the author – Sam Norton, a philosopher and country parson – is reiterating arguments that most of us have often heard before, and to some extent this is the case. The power of his post comes not from covering new ground, but from the clarity and rigour with which it brings together issues that are often discussed in isolation: the political influences that contaminate climate science, reliance on arguments from authority, and the insights that applying dispassionate philosophical analysis to a scientific controversy can provide.
If you are commenting here on what Sam has to say then please, please, lets not have yet another discussion of what Michael Mann’s work may or may not tell us about climate over the last millennium. That is not what the article is about. The Hockey Stick saga has far more interesting things to tell us about the relationship between politics, science and belief at the beginning of the 21st century than whether the 1990’s were the warmest decade for a thousand years – if that matters – and that 1998 was the warmest year.
If you consider commenting at Sam Norton’s blog, then I advise you to get all your ducks in a row first. He seems to be a very pleasant and courteous chap, but note his reply to ‘Tess’, third comment down.
Kudos to Andrew Montford (aka Bishop Hill) whose book The Hockey Stick Illusion is helping to bring what appears to be a rather grubby scandal to the attention of a far wider circle of people whose views are valuable.
Max,
Where does it say “maximum” on the graph? It looks to me that its says “recent climate model predictions”.
So which predictions do you mean, exactly?
Pete,
I see……..human induced global warming is occuring everywhere except Central England……….got it.
Brute,
“Everywhere except Central England?”. No, of course not, but Central England is only a tiny part of the globe so any observable temperature trend is not so conclusive.
If you do the graphing properly though, you can still see the same warming trend.
I have use exactly the link quoted in post #20
PeterM
It doesn’t, Peter.
IPCC’s “predictions” (SPM 2007) for next century range from a minimum of 1.1C to a maximum of 6.4C for the various “scenario” and “storyline” assumptions fed into the models.
Nobody pays much attention to the “minimum” figure, do they? (It’s a yawner.) But the “maximum” figure gets trumpeted all over the place as a “preview of coming disaster”.
The CET graph (with a different scope and different start/end dates) gives only one figure of around 7C (17C – 10C), which corresponds closely to IPCC’s “maximum”.
If one reads the fine print of IPCC, it appears that the temperature increase projected for higher latitudes is somewhat greater than that projected for the tropics, so it would be reasonable to assume that the UK would see a slightly higher warming than the global average, since over half of Earth’s surface area lies at latitudes lower than the UK.
It’s all a bunch of “hokum” anyway, Peter (as we both know), but the graph does check with the maximum case projected by IPCC (and fed to us by the alarmist media).
Now to your “warming trend line” (28). You show what appears optically to be a much higher “trend line” for the period 1979-2009 than that for 1700-1730, although the raw data show a smaller temperature increase (1.2C for 1979-2009 versus 1.8C for 1700-1730).
Can you explain this? (Your “trend line” looks fishy to me.)
Max
Max
The original CET trend line is here
http://homepage.ntlworld.com/jdrake/Questioning_Climate/_sgg/m2_1.htm
and the compression of the scale by Peter and the selective short term data points used can not disguise the longer term overall trend lines detailed on the link just given (from Jonathan Drake).
Indeed, this may resolve the question mark over the climate model prediction red dotted line we can see here on the screen at #20.
Taking fewer data reference points distorts the trend line (and the shorter the period used the more this will occur)
If we check the 1700 to 1735 period (i.e. a similar period to the one quoted by Peter) we end up with the trend equation:
y = 0.02375 – 31.487
In other words the temperature is increasing by 0.24°C per decade or 2.4°C per century an increase in temperature rate very similar to todays.(Recent CET is however known to not properly reflect uhi as the 1974 adjustments were inadequate)
If we continue that trendline from 1730 (an absurd thing to do but a technique beloved of modellers) it can be seen that the predicted mean average CET temperature around now should be of the order of 16.5C. (which is what is shown on #20) Perhaps that is the origin of the ‘climate model prediction’ phrase?
In reality the real mean is very substantially lower.
The overall rise in temperature throughout this 1700 period is substantially greater than the modern period, as it ranged from very cold to very warm in a few decades, so the current rate of warming is hardly unprecedented.
tonyb
PeterM
I thought you had more savvy than you are demonstrating here. You are dismissing something you know nothing about just as you dismiss sceptical views of the climate. This was the point of the original post and you have demonstrated this perfectly.
I cut and pasted a Quote, I won’t say from where because we will have 10 posts about the waco tendencies of the poster from you, rather than any reasoned argument about the science. I had hoped this quote would better illustrated the point I was trying to make, which you dismissed with a mention of Einstein theory of relativity, further demonstrating you didn’t check your facts. Is this how you conduct your discussions in climate science?
To get back the point which is that there is much we think we know that often turns out to be incorrect. I was not agreeing or disagreeing with the quote. I don’t know enough about it, but the very first time man conducts an experiment to test 2 theories we have an unexplained deviation that could invalidate everything we think we know. Or put another way our model didn’t work.
Now on earth we have a long history of measuring things to prove that what we think we know is correct. That has been thrown out when it come to climate science, and we now model things and dismiss the measurement when they don’t fit our model. I think I can spot something wrong here, how about you Peter, can you?
PeterM
Referring to your CET “trend line” (28)
A more detailed look at the CET record confirms my suspicion that the trend line you have shown (with the rapid acceleration toward the end) is “fishy”.
I have taken two 50-year periods:
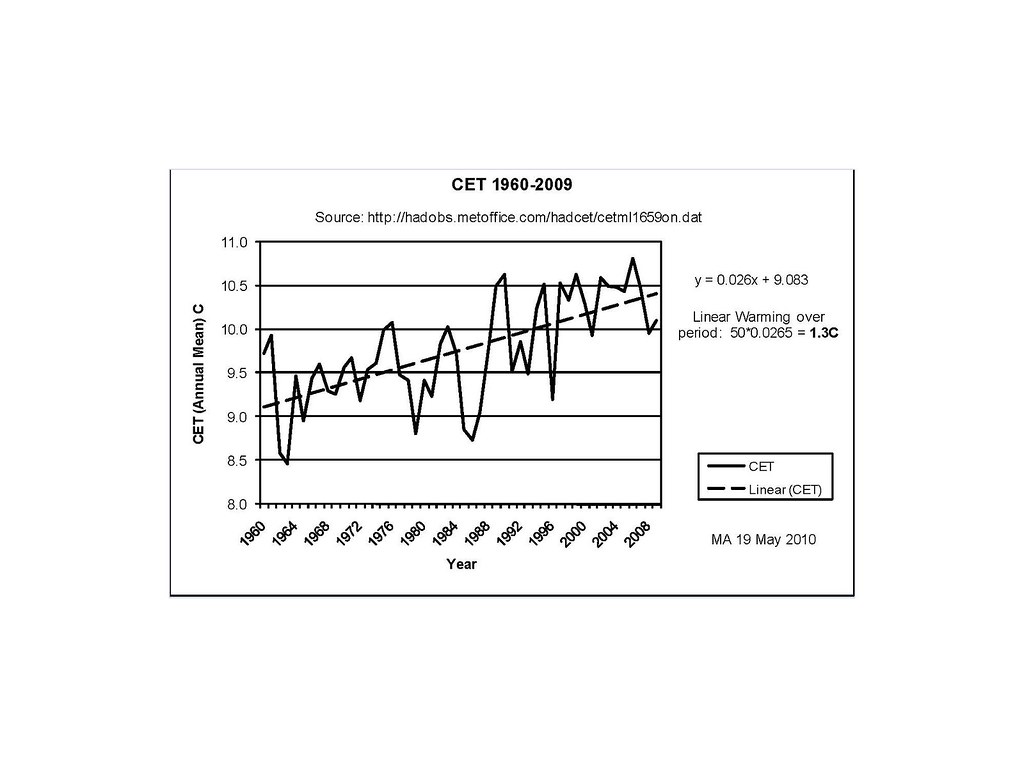
From 1960 (when human CO2 emissions were in full swing) to 2009.
From 1690 to 1739 (when there was essentially no human CO2).
The older period shows a linear rate of warming of 0.0361C/year or 1.8C over the 50-year period.
The most recent period shows a linear rate of warming of 0.0265C/year or 1.3C over the 50-year period.
This is what I suspected earlier, based on just eyeballing the overall curve, but now I have confirmed it.
There is no apparent accelerating trend as you have shown.
Max
PS I can post the curves for the two periods, if you’d like.
I was away for all of yesterday, so I’m only catching up with this thread now.
Peter G #9:
I’m sure that your point about science being corrupted by government funding is sound. The Climategate emails are testimony to that, if nothing else.
The nineteenth century was, arguably, the golden age of scientific research. The previously laid foundations of the main disciplines were systematically built on to feed through into industrial, technological, social, and philosophical changes that impacted every aspect of daily life. The ground breakers were not government funded institutes, but freethinking individuals (usually of independent means) who in spite of being subject to some peer pressure and the constraints of contemporary ethical mores were, to a great extent, in a position to ignore both if they chose. Political pressures were, so far as I am aware, insignificant or non-existent.
Contrast that with a recent statement by Rajendra Pachauri concerning the Inter-Academy review of IPCC procedures:
Once scientists have ‘masters’, in the sense that Pachauri implies, then the link with the golden age of science is well and truly broken. Corrupted science becomes inevitable.
Max, #10:
P. Gosselin usually has something interesting to say, but on this occasion I am sure that he is taking a rather superficial view of what is a very complex issue.
Since the middle of the last century, the close bond that even the developed nations had with the natural world has been broken as the agrarian component of their economies and cultures has steadily eroded. And there is no questioning that CAGW is entirely the brainchild of the developed world.
This has created perfect conditions in which hubristic notions about being in control of the climate can flourish unchallenged. Gosselin’s notion that the present situation will be perpetuated primarily by the baser motive to which we are all subject seems simplistic to me.
TonyB
Our posts apparently crossed, but they are in agreement.
To avoid the “short term” versus “longer term” comparison (an IPCC specialty), I have taken two 50-year periods:
The most recent 50 years and a period covering the late 17th to early 18th century warming, to which you have referred earlier.
This comparison shows, indeed, that there has been no acceleration in the rate of temperature increase as a result of CO2 emissions, but (as you have written) that natural variability overshadows any GH effect from CO2.
So we are on the same wave length.
Max
Max #34
The main point is that we have these historic instrumental records and a wealth of observational material to back up the generality of the trends.
These records were hijacked by much of climate science who ignored history and chose to concentrate on computer models which even the IPCC have admitted are flawed (as we have both commented on numerous times)
I am currently writing a major article on the Little Ice age and attempting to go back to the Roman Optimum. We are on a gently rising trend from probably about 1620-maybe a little earlier- which followed a sharp drop from the MWP that gathered pace from around 1320.
If people want to make a case for the effect of radiative physics from around 1970 that is a reasonable argument to make, but the fact that so much time is spent trying to rubbish the climate variability of earlier ages makes me increasingly suspect that they realise their case is not as secure as they claim.
Clouds, solar, currents, ocean temperatures, jet streams, winds, and all the other factors that act as a driver or thermostat are barely understood as yet, but a variety of people try to claim the science is settled and that positive feedbacks will greatly amplify the effects of Co2.
Peter is welcome to make a case for radiative physics over the last 40 years, but he should not rely on Dr Manns increasingly threadbare reconstructions.
Tonyb
Max,
A pre-industrial, thermometer measured warming trend?
I’d like to see that!
Brute
The two CET graphs for the most recent 50-year period and the 50-year period at the end of the 17th and early 18th century are:
CET 1690-1739
http://farm5.static.flickr.com/4036/4622046500_00686dca8c_b.jpg
CET 1960-2009
http://farm5.static.flickr.com/4035/4621441329_1bd0fe39f5_b.jpg
These show that the earlier period had a faster warming rate (despite no human CO2 emissions) than the most recent period (despite accelerated human CO2 emissions).
And the data for the first period did not get the same amount of “variance adjustment”, “homogenization” and “ex post facto correction” as the current period, plus (as TonyB wrote) there was no “urban heat island” distortion back then.
So much for “rampant AGW”…
Max

Max and Brute
Here are linear regressions for some of the oldest data sets in the world-all show the same slight warming trend over centuries.
http://i47.tinypic.com/2zgt4ly.jpg
http://i45.tinypic.com/125rs3m.jpg
Tonyb
TonyN: “The ground breakers were not government funded institutes, but freethinking individuals (usually of independent means) who in spite of being subject to some peer pressure and the constraints of contemporary ethical mores were, to a great extent, in a position to ignore both if they chose.”
Tony, I think that description could also apply to the bloggers of today. Apart from the “independent means”, I suppose, although as publication on the internet is completely free, this is not an obstacle, arguably.
Alex:
You can also relate it to the fact that many sceptical scientists who made their mark in mainstream research are close to, or past, retirement.
Sorry, TonyN, but they’re old (as you admit) and they’re white – and, gulp, they’re male. Clearly not to be taken seriously.
TonyB
Your “oldest data sets in the world” all seem to confirm the conclusions reached from examining the CET record more closely: there has been a gradual warming trend over the centuries, as we have recovered from the LIA, which has nothing to do with human CO2 emissions. Observed warming rates were greater in the late 17th and early 18th century than they have been over the most recent warming period.
The myopic fixation of IPCC on the past 30-year “blip” in our planet’s climate at the same time as CO2 increased exponentially represents a basic weakness in the science supporting the AGW premise (which is apparent in the argumentation of PeterM).
It is also apparent that we are seeing “agenda driven science” here, which has very little to do with true science, as is being exposed by the recent revelations.
Keep up your good work of exposing this weakness by going back into the long-term record.
Max
Robin
You wrote to TonyN about dangerous AGW skeptics:
Now we all know that there are many “non-white” male scientists who are skeptical of the dangerous AGW premise (many from China, Japan or India), but here are a few “non-male” scientists, who also share this skepticism:
Dr. Sallie Baliunas, astrophysicist and climate researcher, Boston, Mass.
Dr. Sonja Boehmer-Christiansen, Reader, Department of Geography, University of Hull, UK, Editor, Energy & Environment.
Dr. Susan Crockford, PhD (Zoology/Evolutionary Biology/Archaeozoology), Adjunct Professor (Anthropology/Faculty of Graduate Studies), University of Victoria, Victoria, British Colombia, Canada
Dr. Joanne Simpson, Atmospheric Scientist and PhD in meteorology and formerly of NASA
I cannot vouch for the “age” of these ladies (but “age” is obviously not a topic one discusses with ladies, anyhow).
Max
Max,
The raw data for the CET graph in my post #28 came from
http://hadobs.metoffice.com/hadcet/cetml1659on.dat
as referenced in the graph of Brute’s post #20
If anyone thinks I cheated or massaged the graph in any way I’d be happy to email the Excel spreadsheet for your perusal.
The red line is a polynomial fit to the raw data, the thick black line in a 10 year rolling average, which I prefer, but you can take your pick. The thin black line is the linear regression going back to 1659. This does show an linear warming of 0.26 degC per century but the point to be observed is that both the 10 year rolling average and the polynomial fit for the data are showing temperatures between 0.75degC and 1degC warmer than would be expected from the simpler linear fit.
Tony Geany,
Come , don’t be shy, tell us where you got the sentence about Newton and Einstein being fundamentally flawed? You know that good science requires you to give references.
Some creationists seem to have a bit of a problem with Einstein, finite universes and big bangs etc. It wouldn’t be them would it?
sorry Peter Geany
PS I’ve just noticed that the red line in my graph of post #28 looks a bit like a hockey stick!
The handle is a bit wavy but the blade is clearly visible!
This is absolutely the greatest……………
The fruitcakes in the Los Angeles City Council threaten to boycott Arizona because of Arizona’s policy regarding ILLEGAL immigration. (which is exactly the Federal law).
The Arizona Commissioner of Utilities is counter threatening to turn of the electricity (generated in Arizona) to the city of Los Angeles if they go through with it.
Oh how I’d love to see all of those California liberals whine when they are sitting in the dark…………maybe Arizona could tell them that Los Angeles needs to “go green” (forcibly).
Let’s see how dedicated the Leftist Eco-Chondriacs are to the non-existent drowning polar bears while they sit in the dark………………
How sweet it is!
Arizona threatens to pull plug on LA’s power if city goes through with boycott…
http://www.nbclosangeles.com/news/local-beat/Power-Play-Over-Immigration-Law-94251079.html
Peter M: “I’ve just noticed that the red line in my graph of post #28 looks a bit like a hockey stick!”
Ah, that would account for the almost supernatural feeling of unease and dread I felt when glancing at it. ;o)
Like Dracula, the Hockey Stick never truly dies…
PeterM
Yep. You’ve seen one, you’ve seen them all. They can be drawn without even having any underlying data, if you use the right statistical machinations (as Mann proved).
Max
PS As I pointed out, the (unsmoothed) CET data show that the pre-industrial 50-year period 1690-1739 had a more rapid linear rate of warming than the most recent 50-year period 1960-2009, with record CO2 emissions.
Pretty clear evidence, Peter, that there is something more powerful than human CO2 at work here.
Otherwise, how can you explain this?
Max
Brute
Looks like LA-LA-land is in for some dark nights (47).
But, worse than that, Arizona may soon start cutting back on their (Colorado River) water supply .
Don’t know what JZSmith thinks of all this, but if that happens the Angelinos will have to give up their green lawns and plant cacti (or other desert flora) instead.
A business opportunity beckons: the Arizona folks could supply them some of their surplus saguaros (along with the Mexican workers to plant them).
Max