
While catching up on things this morning, a link at Bishop Hill took me to one of the most penetrating and concise commentaries on the Hockey Stick controversy that I have seen, and it comes from a rather surprising source.
I’m not going to attempt to summarise what it says, mainly because if I did so it would probably give the impression that the author – Sam Norton, a philosopher and country parson – is reiterating arguments that most of us have often heard before, and to some extent this is the case. The power of his post comes not from covering new ground, but from the clarity and rigour with which it brings together issues that are often discussed in isolation: the political influences that contaminate climate science, reliance on arguments from authority, and the insights that applying dispassionate philosophical analysis to a scientific controversy can provide.
If you are commenting here on what Sam has to say then please, please, lets not have yet another discussion of what Michael Mann’s work may or may not tell us about climate over the last millennium. That is not what the article is about. The Hockey Stick saga has far more interesting things to tell us about the relationship between politics, science and belief at the beginning of the 21st century than whether the 1990’s were the warmest decade for a thousand years – if that matters – and that 1998 was the warmest year.
If you consider commenting at Sam Norton’s blog, then I advise you to get all your ducks in a row first. He seems to be a very pleasant and courteous chap, but note his reply to ‘Tess’, third comment down.
Kudos to Andrew Montford (aka Bishop Hill) whose book The Hockey Stick Illusion is helping to bring what appears to be a rather grubby scandal to the attention of a far wider circle of people whose views are valuable.
PeterM
PS The raw data for the CET graphs in my post #37 also came from
http://hadobs.metoffice.com/hadcet/cetml1659on.dat
(as noted on the graphs).
The linear trend lines (as used by IPCC) for the two 50-year periods came from Excel, based on the raw annual data as reported (no “10-year moving average adjustment” or other manipulation made beforehand).
Max
Hello Peter
Why would you use a polynomial trend when we have a sufficient time span and data points for a linear trend to adequately show the overall picture?
As this and other climatic research data illustrates, the slope of a linear trend can still represent ‘the most compact and convenient method of describing the overall change in some data over a given period of time.’
As we are looking at the entire trend not a part of it the linear regression remains an effective tool.
The problem with a polynomial trend is that it has the disadvantage that it behaves unstably at the end points.
Steve Mcintyre and William S Briggs and VS are all interested in the statistical niceties of using methods that force the data into a trend that isn’t apparent when the entire data base is examined as a whole.
http://www.climatescience.gov/Library/sap/sap3-3/final-report/sap3-3-final-AppendixA.pdf
Tonyb
TonyB,
You’ve got it the wrong way around when you say “As we are looking at the entire trend not a part of it the linear regression remains an effective tool.”
A linear regression is the first approximation when faced with a collection of data points. If you only have two points then only a straight line is possible – so that’s all you can do. As the number of points increases the correlation between the points is often better if second order terms are allowed.
For example, if you plotted out the price of a loaf of bread over a short timescale, say a few years, a linear fit would be pretty good. However, if you were to look for, as you put it, “an entire trend” over several hundred years then a linear regression would give a poor fit to the data.
PeterM and TonyB
IPCC uses the linear trend approach for medium-term temperature data series (30 to 100 years). This makes good sense. In this manner it established that there were two distinct multi-decadal warming periods in the 20th century of approximately equal duration and warming, with a multi-decadal period of slight cooling in between.
Where IPCC makes a basic mistake is in those instances where it compares trends of different time lengths in order to show “acceleration” in warming (Ch.3 FAQ section has a glaring example of this).
In a slightly tilted quasi-sinusoidal curve (like the observed temperature record), one can always find shorter-term periods with a higher slope than longer-term periods.
IPCC falls into the same trap in SPM 2007 where it tells us that the rate of warming over the last 50 years is almost twice the rate over the last 100 years, implying an acceleration, which does not exist in actual fact. [The rate over the first 40 years is almost twice that for the entire 100 years, but this does not prove a deceleration in warming either, either.]
The linear trend gives a good comparison for medium- to long-term time periods of equal length, such as the 50-year CET periods from 1690 to 1739 (pre-industrial) and the most recent period from 1960 to 2009 (maximum CO2 increase).
This comparison shows no apparent acceleration in warming due to the anthropogenic CO2 increase (even a slightly lower rate of warming than for the equivalent pre-industrial period).
This is a much better way to see if CO2 has been a primary cause for an acceleration than drawing a polynomial trend line over the entire record or simply smoothing it out with 10-year averages.
Drawing a linear trend line over the entire CET record tells us that we have seen a slight warming since this record started. The same is true for the HadCRUT global record, with all its known “warts and blemishes”.
Linear trend line comparisons make sense, but only if the time periods being measured are equal in length.
Max
PeterM and TonyB
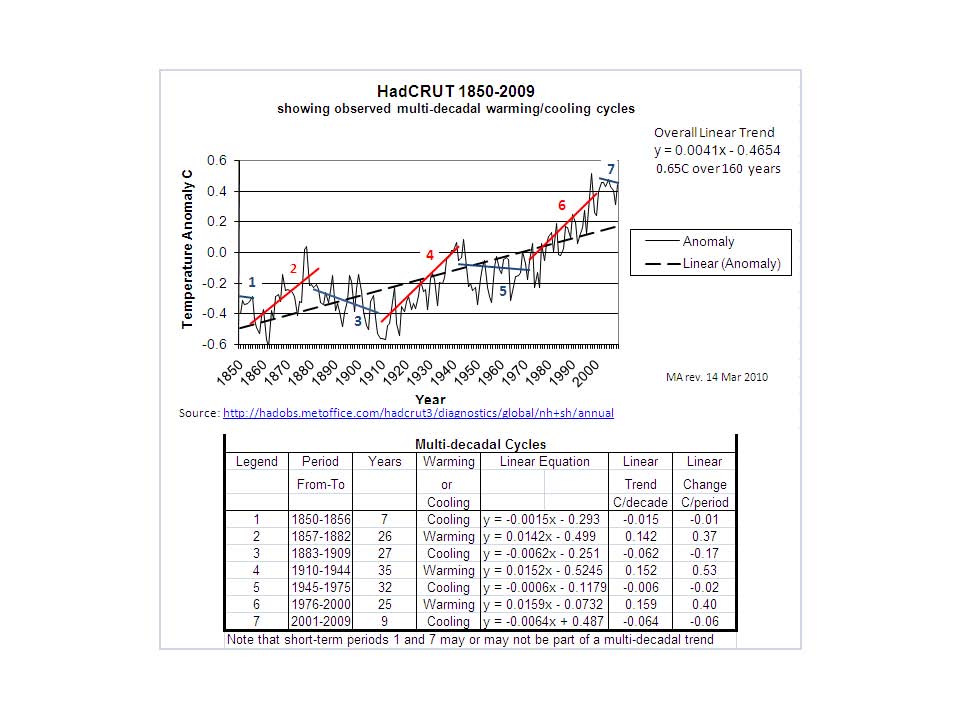
We discussed the use of linear regression to determine warming trends over multi-decadal cycles, as we have seen in the CET or HadCRUT records, for example.
HadCRUT 1850-2009 with Multi-decadal Cycles
http://farm3.static.flickr.com/2702/4503452885_79b5c09c4f_o.jpg
This type of analysis shows the observed multi-decadal warming cooling cycles and provides a linear trend analysis for each of these cycles. IPCC has used this approach in describing the two warming cycles in the 20th century, as well as the slight cooling cycle in between.
The HadCRUT record shows that these warming and cooling periods occurred in a quasi sinusoidal curve with a half-cycle of around 30 years and a slightly tilted axis and no real statistical correlation with GHGs (primarily CO2).
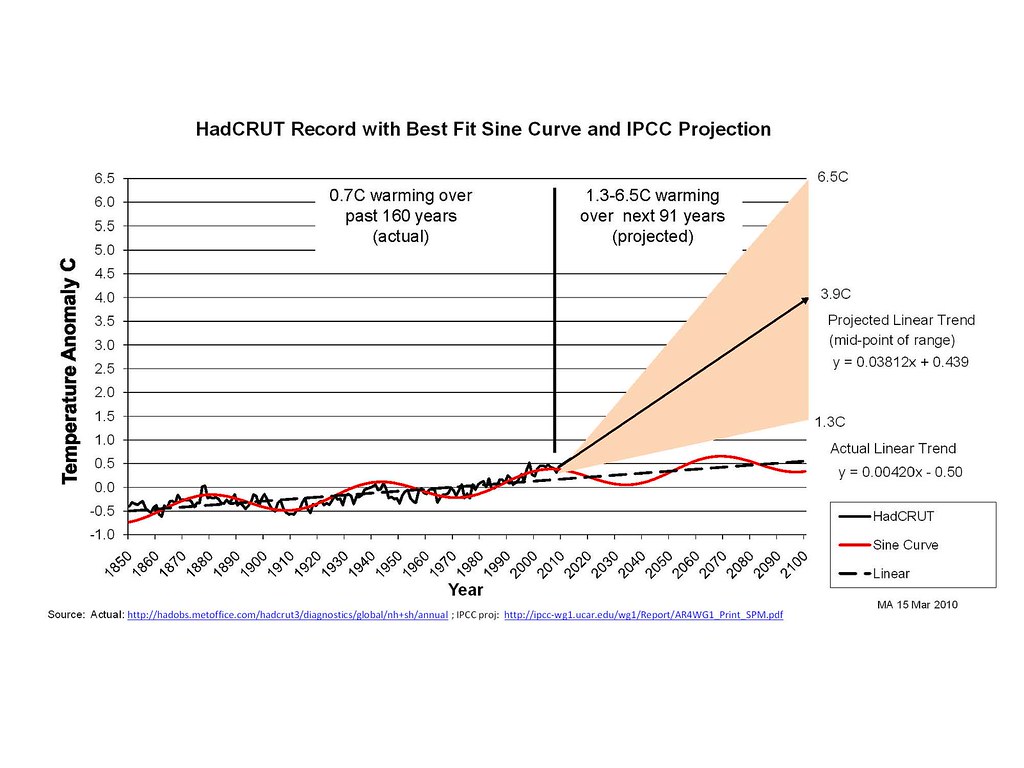
The past record is one thing, but similar analyses can be made for future projections (although it is quite obvious that the past will not automatically repeat itself).
HadCRUT record with “best fit” sine curve and IPCC projection
http://farm5.static.flickr.com/4063/4542439127_3c4ce6f214_b.jpg
If we use the past record to project the future, we see that the warming expected by year 2100 (the next 91 years) will be around 0.4C, whereas the IPCC model simulations project warming of 1.3C to 6.5C over this same period, with a mid-range projection of 3.9C, or 10 times the warming rate we have seen so far.
The first 9 years of the 21st century have shown cooling of almost 0.1C per decade, although IPCC had projected warming at 0.2C per decade. The Met Office tells us that this cooling was caused by unexpected “natural variability” (which apparently more than offset the effect of record CO2 increase over the period).
So what will happen between now and year 2100 is anyone’s guess.
IPCC tells us it will warm more rapidly than seen in the past, due to AGW.
Studies by several solar scientists project a prolonged cooling trend before the underlying slight warming trend takes over again later in the century.
Who knows who is right? Only time will tell.
Max
Max and Peter
Max thanks for your two posts
In this following link the author examines CET through a wide variety of graphs.
http://mclean.ch/climate/England_Scotland.htm
Graph 3 shows particularly well that the cold winters have been reducing for many years (the trend since 1690) as would be expected as the climatic minimum of the LIA was left behind.
The next link graphically shows that winters are much more variable than summers (as is common worldwide) with a much greater temperature differential range. For example in the 350 year CET record Summers have a maximum extreme range of 3.5c whilst Winters have a maximum extreme range of up to 8c.
Summer temperatures have shown little signs of rising to any particular extent, whilst winters have become notably less cold(as observed by Phil Jones in my #23)
The many cold winters during the LIA-say up to 2 Degrees C colder than ‘average’- would severely depress the mean average for that entire year, even though the temperatures during the rest of the year may have been similar to modern day values.
So we are gradually becoming less cold due to the overall warming of winters -thereby affecting the mean average-rather than becoming warmer through an increase in summer heat.
The variability of winter/summer can be seen in this link which shows this gently warming trend
http://climate4you.com/CentralEnglandTemperatureSince1659.htm
Temperatures are not rising in a hockey stick manner as Peters graph attempts to demonstrate. All the old datasets on my site display similar characteristics to CET
http://i47.tinypic.com/2zgt4ly.jpg
http://i45.tinypic.com/125rs3m.jpg
Where there is a ‘twist’ at the end it is often clearly attributable to UHI as noted in my article citing the UHI studies of Uppsala/Stockholm carried out by the local University.
http://chiefio.wordpress.com/2009/10/09/how-long-is-a-long-temperature-history/
Warming has not suddenly taken off since 1880-Hansen merely plugged into the end of a well established trend.
tonyb
Peter Geany,
You say “I won’t say from where because we will have 10 posts about the waco tendencies of the poster from you, rather than any reasoned argument about the science.”
“reasoned argument”? Mmmm! Why do you need that? It looks like this quote was from no less an authoritive source than Conservapedia!
http://www.conservapedia.com/Pioneer_anomaly
Its not a mystery at all. Conservapedia, and “creationist scientist” Dr. D. Russell Humphreys explains it as follows:
“The only non-standard assumption I used was that the matter of the cosmos is limited in extent, with a fair amount of empty space beyond the matter—an assumption supported by the Bible. With those relatively modest beginnings, I was able to explain the Pioneer anomaly — it’s due to a change in the ‘fabric’ of space.”
So there you go. Who needs Newton or Einstein when you’ve got the Bible?
PeterM
Not to split hairs here, but you berate Peter Geany (57) for allegedly citing a quotation from Conservapedia (an assumption on your part, to start off with).
If you look closer, however, you will see that the article you cited refers to two papers, both from reputable scientific sources:
http://www.sciencedirect.com/science?_ob=ArticleURL&_udi=B6TVN-4MV74YK-3&_user=10&_coverDate=03/01/2007&_rdoc=1&_fmt=high&_orig=search&_sort=d&_docanchor=&view=c&_acct=C000050221&_
William F. Hall (Science Direct), 2007: “Can charge drag explain the Pioneer anomaly?”
And
http://www.symmetrymagazine.org/breaking/2008/04/13/pioneer-spacecraft-a-step-closer-to-being-boring/
“Pioneer spacecraft a step closer to being boring”, (Symmetry Breaking), (APS Meeting, April 2008)
Just to set the record straight (although this is not my discussion).
Max
PS You have an unfortunate tendency to jump to unsubstantiated conclusions and to discredit articles, which you personally believe come from sources, whose scientific qualifications you personally find lacking. In view of all the revelations of sloppy or agenda-driven science, exaggerations of potential hazards, and outright untruths in the latest IPCC reports, one could do exactly the same here. But it is always best to attack the substance, Peter, not just make a blanket attack of the source.
Just a tip for making your debating logic a bit more credible.
TonyB
In looking through all the historical charts you posted, I have found the dreaded hockey-stick!
It’s not a “temperature” hockey-stick, however (this does not exist in the record), but a CO2 hockey-stick.
Human CO2 emissions have gone up almost exponentially since WWII (although the latest 5 years have been at a slightly lower CAGR than the previous 5 or 10 years).
But strangely, despite this “hockey-stick” in the “pincipal driver of our planet’s climate, according to IPCC, temperature does not seem to follow.
Wonder why? Could IPCC have it all wrong? Is the Met Office onto something with its “natural variability” explanation for the current cooling?
Shhh. Don’t tell PeterM – he’ll be devastated.
Max
PeterM and Peter Geany
[Tried sending this earlier, but the spam filter didn’t like all the links, so am sending these separately.]
The “Pioneer anomaly” intrigued me, so started checking it out.
Wiki also discusses the “Pioneer anomaly”, stating that the cause is unknown:
[See Link 1]
Here under “13 things that do not make sense” from New Scientist (number 8)
[See Link 2]
This article also states that the cause is unknown, but then speculates:
Here is another study, which speculates on causes:
[See Link 3]
And yet another:
[See Link 4]
Lots of stuff out there on this phenomenon in respected journals plus Wiki.
Max
Link 1
http://en.wikipedia.org/wiki/Pioneer_anomaly
Link 2
http://www.newscientist.com/article/mg18524911.600-13-things-that-do-not-make-sense.html?page=3
Link 3
http://www.stardrive.org/index.php?option=com_myblog&show=review-of-modern-physics-january-2010-on-nasa-pioneer-anomaly.html&Itemid=56
Link 4
http://www.space-time.info/pioneer/
Max #59
Can I make what should be a blindingly obvious statement?
It is very difficult to detect any man made element superimposed on the gently warming trend we can observe over the last 350 years, despite spending Billions on the search.
That upward trend is likely to continue-although as the natural cause of it seems completely unknown, that is speculation.
Where man has a definite and clearly defined input on climate however is through UHI, as shown by nmerous studies and our own first hand observations.
It was an effect first observed by the Romans who took measures to build their ‘streets narrow and buildings high’ in order to mitigate it.
I do not believe that UHi will warm a city in an exponential manner, as urban development tends to spread and the heat will therefore become dissipated over an ever wider area rather than become concentrated.
In many cities UHI might be welcomed as the means to make life more tolerable-especially in the winter in Northern Latitudes.
In some cities UHI will impose a very uncomfortable footprint and in turn require increased use of energy to mitigate it.
So man controls the local climate by the very nature of clustering together. This UHI difference can be readily up to 3-5 Degrees C-as the Victorians measured it-an amount far greater than any known or likely CO2 warming over the next hundreds of years.
So we need to concentrate on mitigating the much greater effects of UHI- where that will be a problem-rather than attempt to control a gas whose impact is still highly debatable.
What do you think?
Tonyb
Can anyone explain why so-called climate sceptics are arguing that the CET record, which shows a warming of approximately 1.3 degC ( measured on a roling 10 year average) since the middle of the 15th Century, is evidence of a very slow natural change in climate, but on the other hand very similar amounts of warming, and maybe even less:
http://www.realclimate.org/index.php/archives/2008/09/progress-in-millennial-reconstructions/
but measured over a much greater area are dismissed as “alarmist” when reported by mainstream science?
Correction: Should be “….middle of the 17th Century”
So that sorted then, we both agree that a slow gentle natural rise of around 1 Degree C since the depths of the LIA 320 years ago-or a fraction of that if measured from the warm period that immediately folowed it-is nothing to get concerned about.
http://climate4you.com/CentralEnglandTemperatureSince1659.htm
I suppose the only thing left to discuss are the reasons for this natural warming trend, but unfortunately that pre-supposes that climate science is much more advanced than it currently is.
tonyb
Tonyb,
If you are saying that the CET record shows a “slow gentle rise” which is “nothing to get concerned about” you’d have to say the same thing about Mann’s graph and all the other hockey sticks which you guys have got so worked up about in recent years. If you plot the CET record on top of these you can see that there is really very little disagreement.
Getting back to the basics of this thread, TonyN wrote:
“Science” (in particular what has come to be known as “climate science”) has become so intertwined with “politics” that it is now inseparable. This can be traced back to the formation of the IPCC, a political organization dedicated to taxpayer- funded research of anthropogenic climate change and its potential impact on our society. The key justification for this effort is (and was from the very beginning) to support the political agenda of levying worldwide taxes on carbon emissions, allegedly in order to stop or slow down anthropogenic greenhouse warming (AGW).
The “science” behind the AGW premise is thus, by definition, “agenda-driven science”. It is not “science” in the classical sense, i.e. “the search for truth”, but rather “the search for proof” of the pre-conceived hypothesis, which supports the political agenda.
If the scientific studies cannot establish a serious potential threat from AGW, there is no need for the IPCC to continue to exist as a body, and there is no justification for the political goal of levying a worldwide tax on carbon emissions.
Climate scientists are fully aware of this fact. Those studies, which conclude that there may be a serious potential risk from AGW, are welcomed and embraced by the politicians who are responsible for providing funding for climate research. Those studies that conclude that there is no real danger or that climate changes are largely natural are less welcome and their authors will have a more difficult time getting new research grants. This fact has been pointed out by many, although some “insider” climatologists still try to deny it.
Now to the topic of “belief”. This is actually a religious, rather than a scientific, concept. It has, however, become an integral part of the “climate science consensus”. There are the obvious comparisons with other pseudo-religious “doomsday cults”: human guilt (for burning fossil fuels in order to become affluent) and retribution (by “Mother Nature” or planet Earth for the transgressions committed). The pseudo-religious aspect has become a basic part of the AGW premise. It has even gone so far as to ignore or reject any evidence, which does not support the “belief” (for example, the recent cooling of both the atmosphere and the upper ocean, despite record increase in CO2). Just like the “doomsday” prophet, whose prophecy does not come about, the AGW-believer comes up with all sorts of rationalizations to explain why the world has stopped warming, ensuring us all the time that the predicted warming is “hidden in the pipeline” somewhere and will “come back with a vengeance” in a matter of time.
The similarities to the Catholic Church of pre-Reformation days are there.
Christian theologians of the time were all part of the “consensus” (as are a majority of the climate scientists today). That a lowly priest, like Martin Luther (in other words, an “outsider” to the “established theological consensus”), would have the audacity to point out the corruption of the Church dogma at that time is comparable to the audacity of the two outsiders, McIntyre and McKitrick in pointing out the corrupted science supporting the “hockey stick” dogma of unprecedented 20th century warming, caused by AGW. The reaction by the “establishment” was also very similar.
I predict that the result will be similar, as well. Just as the “stonewalling” of the Church theologians at the time finally caused the rupture of the Church and the end of its monopoly on Christian religion, so will the current “stonewalling” of IPCC and the “climate consensus” cause a rupture, which will end up making IPCC and the “consensus climatologists” irrelevant.
The Reformation was helped by the invention of the printing press, the resulting gradual increase in literacy and the crumbling of the feudal system, following centuries of war and plagues under this old system. This will happen much more quickly this time around in this age of “instant information”, with blog sites like this one, WUWT, CA, etc. helping to spread this information.
A few more cooler than normal years won’t hurt, either.
Max
Careful, Max. You say that there’s a consensus comprising “a majority of the climate scientists today”. Do you really mean that? If so, I have two questions: (1) do you have any evidence of this consensus? And (2), if so, precisely what is the consensus about?
Robin
No doubt there is a “consensus” among at least a “majority of climate scientists” that:
· CO2 is a greenhouse gas, which theoretically absorbs and re-radiates LW radiation from Earth’s surface, thereby resulting in warming.
· Humans (primarily in affluent, industrialized societies) emit CO2 from fossil fuel combustion.
· Atmospheric CO2 has increased by 23.8% since the Mauna Loa record started in 1958, from 315 ppmv to 390 ppmv today.
· Globally and annually averaged land and sea surface temperature has increased since the modern record started in the mid-19th century.
· This has occurred in roughly 30-year warming cycles, with roughly 30-year cycles of slight cooling in between, an underlying linear warming trend of 0.041C per decade and total warming over the 160-year period of 0.7C.
· Arctic sea ice has receded since satellite records started in 1979, while Antarctic sea ice grew over the same period, at a slightly lower rate.
· Tide gauge records show us that sea level has risen since records started in the 19th century.
· This has occurred at a rate of around 17 cm per century, with a slightly higher rate of rise in the first half of the 20th century than in the second half.
With the exception of the greenhouse theory, the above are all observed facts, within the limitations of the accuracy of the observations.
But now we come to the questionable part, where I have to agree with you that there is no real evidence of “consensus” (we can write off the Oreskes study as basically flawed, as was shown subsequently, or Pachauri’s claims as simple bluster).
But is “perception” equal to “reality”?
And is there a “perceived consensus” of the premises that
· The surface temperature record gives a representative picture of the average global temperature of our planet without any major distortions resulting from urbanization, changes in land use, changes in measurement locations, elimination of a majority of the measurement stations around 1990, etc.?
· Increased atmospheric CO2 has been a significant contributor to the observed 20th century warming?
· Model simulated “positive feedbacks” will triple or quadruple the GH effect of CO2 alone?
· This projected warming will be more harmful than beneficial to human society, and that AGW thus represents a serious potential threat?
I have not seen any compelling evidence to show that there is anything near to “consensus” on the latter premises, although this represents the “party line”, as defined by IPCC.
And it is the “IPCC party line” which we are comparing to the prevalent Church dogma at the time of the Reformation, and which we are calling the “consensus opinion”.
Max
Yes, Max – that’s all good stuff. I’d also be very surprised if there were not consensus about the observed facts you itemise. But beyond that to agreement that, if we continue to emit GHGs, we face catastrophe? I don’t think so. Yet it’s “consensus” on that point (especially the items you mention) we keep hearing about – without any evidence to support the claim. Plainly you agree. But, in the case of the pre-Reformation Church, I suspect there was a consensus amongst churchmen about the dogma. But that was religion – we’re concerned with science. There’s supposed to be a vast difference. Although sometimes I fear that climate “science” gets dangerously close to becoming dogma.
Robin
I believe you have hit the nail on the head: the premise that AGW has caused most of the past warming and will represent a serious potential threat has become “dogma” rather than “science”.
But I would like to carry this reasoning a step further and leave out the purely political and financial aspects for now.
This “dogma” required the elimination of the Medieval Warm Period, in order to claim “unprecedented 20th century warmth, due to AGW” (the theme of this thread).
It required a minimalization of the Little Ice Age, or (for that matter) of any past temperature fluctuations, which could not have been caused by AGW (refer to TonyB’s excellent “Dickens” summary).
It required “manipulated”, ”homogenized” and ex post facto “corrected” temperature data of the more recent record, in order to support the “dogma”.
As we have both pointed out to Peter repeatedly, the AGW premise is not supported by empirical data from actual physical observations (i.e. scientific evidence according to the basic principles of science).
Instead, it is supported by theoretical deliberations and model simulations and summarized in the IPCC reports, the “Bible” for AGW-believers as opposed to prophets, holy scripture or Church theologians, as was the case of religious dogma in Luther’s time, but this difference is minor.
The frequently invoked “appeal to authority” (of the “establishment”) is also not much different from the argumentation used by the Church theologians in Luther’s time.
Just as “intelligent design” proponents attempt to cloak their belief in “science”, so do AGW-believers, on the other end of the dogmatic spectrum. But in both cases the key weakness is the lack of empirical data supporting the “belief”.
So far the AGW “dogma” has not been able to stand up to this test. And, until it does, it remains “dogma” and not “science”.
And it is the mission of rational skeptics (such as McIntyre and McKitrick) to expose any corruption in the dogma, as it was Luther’s mission in his time (TonyN’s theme).
Max
Max:
Back to consensus. To the extent that it’s important (not very – science is not determined by consensus), the research done by Dr Klaus-Martin Schulte is interesting (see this article: Survey: Less Than Half of all Published Scientists Endorse Global Warming Theory).