
While drafting a post on ‘Phil Jones and the ‘expert judgement’ of the IPCC’ recently, a search of the CRU emails threw up a file that did not appear to be relevant to what I was looking for, but it is interesting nonetheless.
Since sceptics started raking through the Climategate emails, interest has focused on just a few dozen of the messages that contain egregiously alarming revelations about how climate research and the IPCC process is conducted. A large number of the emails appear to contain nothing particularly noteworthy. This is strange, given that they all seemed to have been grouped in a single folder for a purpose.
There is some agreement among systems analysts who have considered how this material became public that the FOI2009 folder that appeared on a Russian server in November last year was downloaded in toto from CRU, and had probably been compiled there for a reason or reasons unknown. If this is the case, then it must have been the result of an exhaustive review of, and a process of selection from, a vast amount of material. The folder certainly doesn’t contain the whole contents of any particular mailbox.
The hacked or leaked file was named FOI2009.zip and contained a folder FOI2009, which was divided into two sub-folders: documents and emails. The emails folder is made up of 1073 files each of which contains an email, but many of these also contain chains of messages that are relevant to the primary message at the top of the page. The file that I came across (1168467907.txt) was one of these and contained five messages.
The primary email (dated 10th January 2007) is from Phil Jones to Sir Brain Hoskins, with copies to: “Susan Solomon”, “Kevin Trenberth”, “Brian Hoskins”, martin.manning, “Matilde Rusticucci”, “Phil Jones”, “Peter Lemke”, “Jurgen Willebrand”, “Nathan Bindoff”, “zhenlin chen”,”Melinda Marquis”. (The inclusion of Jones and Hoskins in the copies, in spite of their being the author and recipient of the primary message respectively, suggests that this was a designated mailing list.) All are drafting or contributing authors to the IPCC’s AR4, Working Group 1 (WGI), Summary for Policymakers (SPM) except for Solomon, who is co-Chair of WGI and Marquis who is Deputy Director of the WGI Support Group. Only Jones, Hoskins, Trenberth and Solomon take part in the discussion in the message chain.
The subject under discussion is mid-latitude winds in the context of climate change and extreme weather events, and the way in which research findings relating to this should be summarised in the SPM. The emails were exchanged just prior to the IPCC plenary session in Paris during early February 2007 that would finalise the text. It is important to note that government representatives who have the last word on the text attended this final meeting. The general subject heading in the SPM is Direct Observations of Recent Climate Change.
In order to consider the contents in chronological order it is necessary to start with the last message at the bottom of the page, or in other words, to read the contents from bottom to top rather than top to bottom.
The earliest message is from Sir Brian Hoskins to Susan Soloman.
(Message 1)
Brian Hoskins wrote: [Review editor of WGI Chapter 3 and a drafting author of the SPM]
Susan [Solomon]
Headline 2
I suggest the following:
At continental or ocean basin scale, numerous changes in climate have been observed. Mid-latitude westerly winds (and the associated storms) have shifted polewards and strengthened. Other climate changes include precipitation,…..
I have taken the suggestion form SPM_327 to reverse the order of the first sentence.
The westerly winds sentence is essentially that in a headline in the TS.
I should much prefer not to include the bracketed itallicised phrase on storms. The evidence is less strong. There is some evidence for reduced numbers of storms also but no room to say that. It was not headlined in the chapter or the TS.
Best wishes
Brian
my emphasis
Evidently a piece of copy concerning extreme weather is being hammered into shape and Hoskins has reservations because a claim of increased storm intensity may not be adequately supported by scientific evidence and there is also evidence that the frequency of storms is decreasing.
The next message is from Kevin Trenberth (a cooridinating a lead author on WGI Chapter 3) to Sir Brian Hoskins.
(Message 2)
At 8:54 AM -0700 1/9/07, Kevin Trenberth wrote:
Hi Brian
Do you need the first part? Are you rewriting the headline on SPM p5 lines 35-37 or are you adding an extra bullet on circulation? I thought we agreed on the latter, but your piece seems more like the former.
If we left the headline alone and added:
* Changes in large-scale atmospheric circulation are apparent and, in particular, the mid-latitude westerly winds have shifted polewards and strengthened, altering storm tracks.
would be an alternative approach. I think it is helpful to mention storm tracks but not be specific about how they have changed.
What do you think?
Kevin
my emphasis
Hoskins’ initial reservations about the evidence of stronger winds, and the possibility that the frequency of storms is decreasing have disappeared and been replaced by wording that suggests that only the change in wind patterns is leading to stronger winds and worse storms. Evidently space cannot be found for any caveats.
At this point, one of the biggest guns in the IPCC process, Susan Solomons, provides priority and direction to the discussion, as any good chairman should. At all costs the scientists must deliver what the government representatives want to hear.
(Message 3)
Susan Solomon [Co-Chair, Working Group I, AR4) wrote:
Thanks Brian and Kevin for the help.
I agree with Brian about reversing the order in the headline sentence but agree with Kevin that a separate bullet is most helpful. I suggest we keep the headline short and simple and just leave the language we have about wind patterns being one of several things changing there. Otherwise it could be read as putting the circulation change into a very high prominence in the headline which isn’t quite the emphasis we were discussing, I think.I tried to combine the suggestions and to keep things clear enough that governments won’t complain about lack of specifics. If you look over the comments, you will have seen that above all they will not tolerate vague language. Anybody who was in Shanghai (or any other IPCC meeting) can attest to that so please please everybody help make things as specific as we can.
So my suggestion for the wind pattern bullet is:
Mid-latitude westerly wind speeds have increased in both hemispheres since about the 1960s. This has caused storm tracks to move towards higher latitudes. {3.6}
Regarding the headline that proceeds it, can we consider something like this:
At continental or ocean basin scales, numerous changes in climate have been observed. These include sea ice extent, precipitation amounts, ocean salinity, wind patterns, and [aspects of extreme weather] OR [the frequency of heavy precipitation and of heat waves, the intensity and duration of drought, and the intensity of hurricanes and typhoons.]
The ice sheets have been taken out of the above because they are moving to a consolidated sea level subsection, to deal with several requests for that.
Is the new option after wind patterns too specific? I am a little concerned that we will be challenged on that. We could keep what we have: ‘aspects of extreme weather’. Equally, I am worried that they will challenge the vagueness of ‘extreme weather’ so that is why you see two alternatives here.Thoughts?
Susanmy emphasis
What should a poor scientist do when the bosses want specifics? As Hoskins’ first message shows, there aren’t any other than to say that the scientific evidence for mid-latitude winds becoming a problem is a bit flimsy.
But Hoskins bounces back and he, if no one else, is still worried about the evidence that even if winds are strengthening, the frequency of storms may be decreasing. It’s difficult to blame extreme weather on climate change if there seems to be less of it about.
(Message 4)
Dear All
To me a headline should be kept simple with the detail in the bullets
below, so I prefer the simple version with “aspects of extreme weather”
but I guess I am outvoted on that!For the first part of the bullet on the westerlies I should prefer to
revert to including the shift and also using the word strengthen rather
than increase (a number, such as the speed, increases):Mid-latitude westerly winds have shifted polewards and stengthened since
about the 1960s.The next part on the storms is problematic. I agree with Kevin that we
should steer clear of the causal langauage Susan had used. However
Kevin’s words seemed to link a shift in the storm tracks with an
increase in the winds. Also, as reviewed in 3.5.3, some papers suggest
that, in addition to a poleward shift in the storm tracks and an
increase in their average intensity, there is a decrease in the number
of storms . This is probably too much for the bullet, so that a less
specific version may be required.I think the whole bullet could be:
Mid-latitude westerly winds have shifted polewards and stengthened since
about the 1960s, with associated changes in storms. (3.5)Brian
my emphasis
This is a really skilful bit of drafting that completely avoids the real scientific issues. The wording implies that storms are becoming more of a problem, and also provides for any challenge based on the evidence of decreasing storm frequency with the weasel words, ‘associated changes’.
Finally, Phil Jones joins in, suggesting that if mentioning the storms is inconvenient, then why not just leave them out.
(Message 5)
Dear All,
Agree with Brian’s new bullet. I still think we will
get comments about what changes with storms. If this
is going to lead somewhere we don’t want it and cause
problems, then the final part is likely best removed.Reading it again, better if we say .. since the 1960s.
About is a little vague.Back in CRU on Friday. I may be able to get this hotel link
to work tomorrow morning.Cheers
Philmy emphasis
Evidently Jones had the last word. The final wording in the SPM is as follows:
Mid-latitude westerly winds have strengthened in both hemispheres since the 1960s. {3.5}
We have come a very long way from Hoskins’ first message to Susan Solomon.
When I fist glanced through this message – looking for something else – I wondered how it had found its way into the FOI209 folder. It seemed to be innocuous; just a group of scientists discussing the wording in a report. So I read it more carefully and realised that this email is in fact just the kind of ‘dirty washing’ that the participants would really want to be kept out of reach of any Freedom of Information Act requests.
Ever since the Climategate scandal broke, and led on to Himalayagate and all the other criticisms of the IPCC WG II report, we have been told that none of the revelations have any impact on the big picture; the fundamental evidence for AGW. Yet here we find some of the leading figures in the IPCC process drafting what is supposed to be an objective assessment of research findings in a way that is astonishing.
Apparently there is something going on that is every bit as troubling as ‘hiding the decline’, rigging the peer review process, or refusing to make data available for scrutiny. It seems to reveal a culture where the priority is not science at all, but presentation. And in this instance it applies to the IPCC’s most influential document, the Working Group I Summary for Policymakers. Worse, it involves some of the biggest names in climate science.
It is true that the nature of mid-latitude storms does not provide clinching evidence either one way or the other in the climate debate. But that is not the point.
Assessment, as applied in the IPCC process, is to a great extent a matter of judgement. The most important revelation that the Climategate emails provide is an insight into the culture that exists within climate science. This has been variously described as ‘tribalism’, ‘circling the wagons’, and more recently by Judith Curry in an interview with Discover Magazine as ‘sloppiness’. It is these characteristics, far more than any specific instance of wrong-doing that cast doubt on the evidence for AGW.
When people talk about the fundamental evidence for AGW not being called into question they are considering only a few specific allegations. But we rely entirely on the IPCC for that evidence. It is not too much to say that the evidence for AGW is the IPCC. If the IPCC assessment process is contaminated by a culture that is essentially concerned with presentation, then the whole of that process, and the conclusions that have been reached about global warming, require fresh scrutiny.
The above email suggests that, in this case at least, the IPCC’s priority was massaging the evidence to suit the message. In how many other instances is this the case?
_________________________________________________
H/T to KevinUK for his superb Climategate database with advanced search feature
TonyN:
Nice work. This is an excellent example of the way in which the science is being presented by the IPCC. I waded through the IPCC 2007 report some time ago and it is clear throughout the report that it is attempting to promote a position. The report is a poorly disguised polemic. Issues that have been recently highlighted such as Glaciergate are just the obvious examples of exaggeration. The language of the whole report reflects a bias towards AGW. “Massaging the evidence to suit the message” sums it up nicely.
I know a very senior scientist who was asked to be part of the IPCC team in the 1990s. He agreed to participate until he found out that the intent was to rubber stamp an AGW position so he withdrew. It appears the bias has been endemic in the IPCC from the beginning.
TonyN
Very good report. You are exposing just a very small tip of an extremely large iceberg covering a topic, which is not really that critical to the IPCC message, but the same exaggerations in wording can be found elsewhere in the AR4 WG1 and SPM reports.
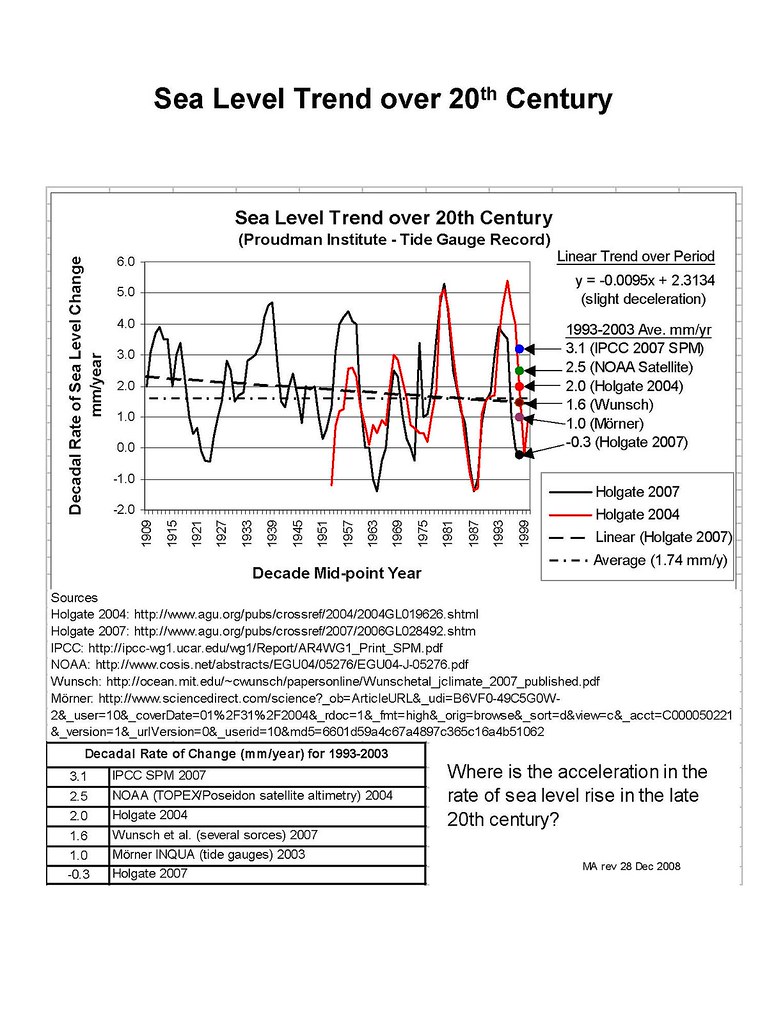
The handling of sea level, a topic more critical to the IPCC message, is a good example of bad science combined with outright dishonesty, in order to paint a false picture of late 20th century acceleration in the rate of sea level rise.
The message is conveyed that global sea level rose at a faster rate over the shorter period 1993-2003 than it did over the much longer period 1961-2003, implying a late 20th century acceleration in the rate of rise.
In actual fact, tide gauge records have shown us that the rate of rise was slightly higher in the first half of the 20th century than in the second half.
Both periods saw large multi-decadal swings in the rate of rise in sort of a sine curve, so that a shorter time frame can always be shown to have a faster rate than a longer time frame (IPCC uses this same ruse in comparing temperatures).
But even more damning than this bit of “smoke and mirrors” is the fact that IPCC has changed the method and scope of measurement with a simple footnote “data prior to 1993 are from tide gauges and after 1993 are from satellite altimetry”.
Tide gauges measure sea level at several shorelines (where sea level has an impact on land dwellers), while satellite altimetry attempts to measure sea level of the entire oceans, except for areas near shorelines or at polar latitudes where satellite altimetry cannot measure.
So IPCC is comparing measurements using one method and covering one scope over one time period with those using a different method and covering a different scope over another time period in order to establish an accelerating trend between the two time periods.
This is “bad science” at best and outright skullduggery at worst.
In addition, the sea level measurements from satellite altimetry have proven to be so totally inaccurate that the errors are often greater than the trends themselves, as conceded by the very NOAA scientists making the measurements.
There are many more examples of similar dishonesty, errors or exaggerations in the AR4 WG1 and SPM reports.
A blogger named PaulM has compiled many of these on a now-defunct CA blog and provided a good summary here:
http://sites.google.com/site/globalwarmingquestions/ipcc
(See #10 on the Harmless Sky: Phil Jones and the ‘expert judgement’ of the IPCC thread)
Max
Max #2
This was a nice article by TonyN.
You know my thoughts on sea level and I remembering posting the background to this some time ago. You then wrote an excellent piece (which I have kept).
The bottom line is that sea levels are considered the ‘gold standard’ of the IPCC and their inexorable rise is taken as a given and rarely challenged. However Chapter 5 provides the background and it is clear that the perceived view is not borne out by the actual (inconvenient)facts.
I am thinking of writing an article on the subject and it would help me to know at what level to pitch it. Before we had our discussion last year would you say that;
1) Generally you accepted the traditional view of rapid sea level rises?
2) You were rather suspicious but thought ‘they’ knew best?
3) You were always highly suspicious but were surprised at the amount of incorrect information and inconsistencies displayed even within Chapter 5
4) You held some other viewpoint.
I am always amazed that this acceptance of sea levels is not challenged more robustly by sceptics and instead we concentrate on parsing global temperaturers to the ‘nth’ degree or the theoretical physics behind the precise degree of co2 needed to raise temperatures by scary amounts with and without feedbacks.
Tonyb
Tony, well spotted, that’s another nice ‘hide the decline’.
The IPCC SPM statement
“Mid-latitude westerly winds have strengthened in both hemispheres since the 1960s.”
was described by Roger Pielke senior as
“perhaps the most astonishing claim made in the report”
just a few days after the SPM was published, see his blog.
More on this story later…
PaulM:
Yes please!
TonyB
Regarding your query on the sea level issue, I would say that prior to SPM in February 2007 I generally accepted the forecasts on sea level rise. I did some checking on the tide gauge history and found that several sources going back to around 1880 showed an average rise of 1.7 mm/year (or 0.17 meters per century). Forecasts for the future were around 0.2 meters per century, which seemed reasonable.
When SPM 2007 came out, my first reaction was to the projected temperature increase. While we had seen 0.6C warming over the past century, this was projected to be 1.8 to 4.0C (with a maximum of 6.4C). It just did not pass my “reality test” that we would see 3 to 10 times the warming we had actually experienced.
So I got suspicious and dug deeper. The more I dug into SPM (the supporting AR4 WG1 report had not yet been issued) the more questionable things I saw. What made me most suspicious of all were actually two things: the arrogant “sales pitch” verbiage and the fact that all of the forecasts appeared grossly exaggerated compared to actually observed experience.
My interest in sea levels started when I saw a 2004 report by Nils-Axel Mörner, a world expert on sea levels, who stated
Mörner also stated that any forecast exceeding 0.2 meters over the next century was “nonsense”.
These were pretty strong words, so I started digging even deeper. The more I dug, the more questionable the IPCC claim became, as I pointed out in my post above.
The table attributing 1991-2003 sea level rise to various factors did not add up. The claims for the contribution from both the Greenland and Antarctic ice sheets also turned out to be false, since long-range studies showed that both ice sheets had gained mass over this period. There was no way to check the claims on expansion due to warming or contribution from non-polar glaciers, but correcting the IPCC figure for just the two ice sheets put the 1993-2003 figure at between 1.4 and 3.0 mm/year (average of 2.2 mm/year).
I then came across a report by Simon Holgate using tide gauge records. These data showed that the rate of rise had been slightly higher over the first half of the 20th century (1904-1953) than in the second half (1954-2003), and that the linear trend showed a slight deceleration in the rate of rise. There were several multi-decadal swings over the century in sort of a sine curve, varying from decadal rates of +5.0 to –1.5 mm/year, but no visible trend of late 20th century acceleration as claimed by IPCC.
I then saw that IPCC had used the trick of switching methods and scopes (see earlier post) in order to get an apparent “acceleration”, so I checked the literature on satellite altimetry to measure sea level. I learned that, unlike measuring a non-moving surface such as an ice cap, measuring a heaving ocean is fraught with great uncertainty. A single ship’s deck can throw off the reading for several square miles. A report by Carl Wunsch stated that the 1993-2003 rate of rise was 1.6 mm/year (half of the IPCC claim of 3.1 mm/year), but that satellite altimetry was still to inexact to draw any conclusions. Another report by Cazenave et al. stated:
I then came across a report by Scharroo and Miller of NOAA entitled Multi-Satellite Altimetric Sea Level Change 1992-2003: What Do We Know And What Not?. This report stated:
So the scientists actually making the satellite altimetry measurements were confirming the conclusion by Wunsch and Cazenave that this method was still too inexact to draw conclusions.
So why did IPCC switch from tide gauges to satellite altimetry?
The answer is obvious. Tide gauge records were being run by independent organizations and individuals, such as Mörner and Holgate, who were not part of the AGW team, while satellite altimetry was run by the AGW-friendly NOAA.
And this is supposed to be “science”.
The whole thing stinks to high heaven.
Max
For a group that now says its only problem is poor PR and messaging, it seems an awful lot of time was spent on wording and crafting a message for the IPCC SPM. Am I the only one experiencing dissonance?
The timing of this is interesting.
The draft SPM was produced in April 06 and commented on by scientists.
The ‘final draft’ was produced in Oct 06, with comments from govts (not scientists) issued on Jan 10 2007, exactly the date of this email. So they are discussing the very final version, that went to press a month later.
Timetables and links to drafts and reviewer comments are here.
Note that in the draft and final draft, there was no bullet point about wind strength at all. So this comment that Pielke describes as the most astonishing in the report was not seen by scientists, but inserted at the last moment (thanks to the steer of Jones, we now know). This trick of inserting things at the last minute into the final draft, to avoid the scientific review, is widely used by the IPCC, a good example being the dishonest comparison of 100 year, 50 year and 25 year trends (also very probably down to Jones, lead author of chapter 3).
(Note that SPM327 refers to a comment on the final draft, by the government of Canada).
Hide the Decline (as in rate of sea level rise over 20th century):
http://farm4.static.flickr.com/3206/3144596227_545227fbae_b.jpg
Average rate of rise:
1904-1953: 2.03 ± 0.35 mm/year
1954-2003: 1.45 ± 0.34 mm/year
Rate over second half of century was 29% lower than over first half.
Ouch!
Max
This is my first visit.
The article is very intelligent.
Thanks for putting it out to be read.
Ever since I first read the Climategate emails I have wondered about that file name. Could it be that this was a file containing traffic the members of the Tree Ring Circus planned to EXCLUDE from FOI disclosure, should their efforts to to thwart the requests finally fail? Looked at as the outcome of a pre-emptive cull, the collection seems to make some sense, does it not?
Steve E:
It would certainly seem that these messengers are being very economical with the information that is at their disposal.
PaulM:
The timing is very interesting. I’ve checked the IISD Earth Negations Bulletin record of the plenary session and there doesn’t seem to have been any discussion of the mid-latitude westerlies.
Tom Forrester-Paton:
One of the questions that the Russell enquiry certainly should answer is the one that you pose. It will be very interesting to see whether that happens.
A very good article, Tony. Phil Jones, Susan Solomon et al come across rather like marketing managers discussing the launch of a product that they know is flawed and that will need some skilful handling in order to sell to as many people as possible without falling foul of trading standards. Extraordinary, really.
These climate scientist guys have too much time on their hands.
I find this phrase damning:
“…keep things clear enough that governments won’t complain…”
In other words, the wishes of governments take precedence over the cautious and precise qualifying statements of actual scientific terminology. Talk about selling out. The report is obviously nothing more than a political instrument designed for propaganda purposes and has no scientific validity.
Tony,
I have added this one to my list (number 40).
While doing so I noticed one more amusing point. Brian Hoskins says twice that there is no room to mention the declining number of storms.
In fact if you look at pages 8-9 of the SPM, where these bullet points are, there are about 10 blank lines of white space at the end of the bullet points on page 9 :)
PaulM
When you add Pielke’s observations, which you linked to above, to what I’ve said in the header post it certainly seems worthy of a place on the list.
Great article of yours!
I’m Emailing it around to people that I think will understand its significance.
Oh, and also, “re-writing Obama’s speech”
Very well written post. Just discovered an excellent site with UK government documents on it – http://www.officialdocumentwatch.com is a really well built site and them seem to be very up to date – always posting the latest UK government documents released to the public. Worth a look.
Jay Taylor
From the site you cited:
Beyond Copenhagen:
The UK Government’s International Climate Change Action Plan
Ed Miliband MP
Secretary of State for Energy and Climate Change
http://www.official-documents.gov.uk/document/cm78/7850/7850.pdf
Some excerpts:
OK. It’s all just a lot of political hot air, and Miliband probably won’t even be around in his job to witness the next global boondoggle at Cancun, Mexico, but this document still sounds very scary to me (and I suspect even more so to UK citizens).
Max
Alex Cull:
With your interest in transcriptions, the following might be worth a glance.
Bishop Hill has a link to an Economist interview with Sir Brian Hoskin’s, who figures largely in the header post on this thread. He seems to be waxing lyrical about the extent to which the IPCC goes in representing uncertainty, something that we mere mortals who are more at home with the SPM’s than the main reports may find surprising. He also has things to say about modelling and understanding mid-latitude storms.
The link is here:
http://bishophill.squarespace.com/blog/2010/7/25/hoskins-climate-models-are-lousy.html
and am I alone in thinking that Hoskins demeanour and body language while he is answering some of the questions is rather disturbing?
TonyN and Alex Cull
I watched the Bishop Hill video twice to see if I could detect anything in Sir Brian Hoskins’ “body language” other than nervousness when answering some of the more pointed (if very civilly posed) questions. He seemed a bit unsure of himself, but I could detect nothing else (maybe a trained psychologist could do a better job).
It is clear that Hoskins (as a scientist) was talking about the detailed 1000+ page AR4 WG1 report, rather than the 18-page SPM report, which everyone other than a scientist reads, when he talks about uncertainty ranges being clearly pointed out. The biggest problem that many people have with the SPM report is that this high degree of uncertainty is not expressed. Instead one is led to believe (in the very opening paragraphs and later throughout the report) that there is a high degree of certainty in the observations as well as the projections.
Etc. ad nauseam.
Does not sound like there is much uncertainty or doubt at all, as Hoskins has expressed. (I also miss the part where Hoskins tells us the “models are lousy”.)
Max
TonyN, Max, I’m not an expert by any means whatsoever, but Sir Brian Hoskins’s body language does appear to change quite dramatically throughout the video. At the start, he is extremely guarded and contained in his facial expressions (e.g., at the 2.00 mark) and his gestures, keeping his arms tightly folded in front of him. The 2.20 – 2.40 area is also interesting, when the interviewer talks about subconscious bias and group think; he nods very rapidly and appears to hang his head. He does open up considerably just before the 4.30 mark – this is where the interviewer asks him “How bad were the climate models when you started out?” and he answers “They were pretty lousy, and they’re still pretty lousy, really…”
After this, his demeanour seems far more relaxed; it’s almost as if he feels relieved. It is impossible, of course, as it were to psychoanalyse someone at a remove like this (but naturally very tempting to try, anyway!); one interpretation might be that he was uncomfortable discussing the IPCC, but then far happier talking about the shortcomings of the early climate models (on safer ground, so he felt he could loosen up a bit?) The “they’re still pretty lousy” remark was surprising, though, and from that moment on, there was (perhaps) a feeling of “now I’ve said it, and can relax!” – even though there were more qualified statements to follow. This is strictly one possible interpretation out of many, I would stress, and one which probably reflects my own biases.
It is interesting to watch the video with the sound off, just to focus on gestures and facial expressions (it’s fascinating to do this sometimes with TV programmes, as you notice different things.) Also, of course, it’s rewarding to read the words by themselves, to see what is revealed there. I’ll see if I can do a transcript of this interview (while it’s still available!) and will post a link.
Alex:
Hoskin’s demeanour reminded me very strongly of Jones when he was giving evidence to the HoC Science and Technology Committee, here, about half way through.
It is understandable that Jones was nervous, ingratiating and very guarded in his utterances on that occasion, but less so in the case of Hoskins when confronted with nothing more intimidating than an Economist journalist. And in both instances there seemed to be a suggestion that the interviewee does not really expect their answers to be accepted at face value, not the kind of self confidence that you would expect from someone with a clear conscience. But perhaps I am reading too much into it.
Just to say I’ve done a quick transcript of the Hoskins interview here. Hoping to add some more to this new site over the next few days – any comments and tips re formatting, searchability etc., will be appreciated.